
29 Burj Dubai Boulevard
Project details
29 BD BLVD on TableauDecember 2022
Tableau Visualization, OpenData, Interactive Dashboard, Property Insight, Real Estate Analytics, Data Driven Decision
Brief description
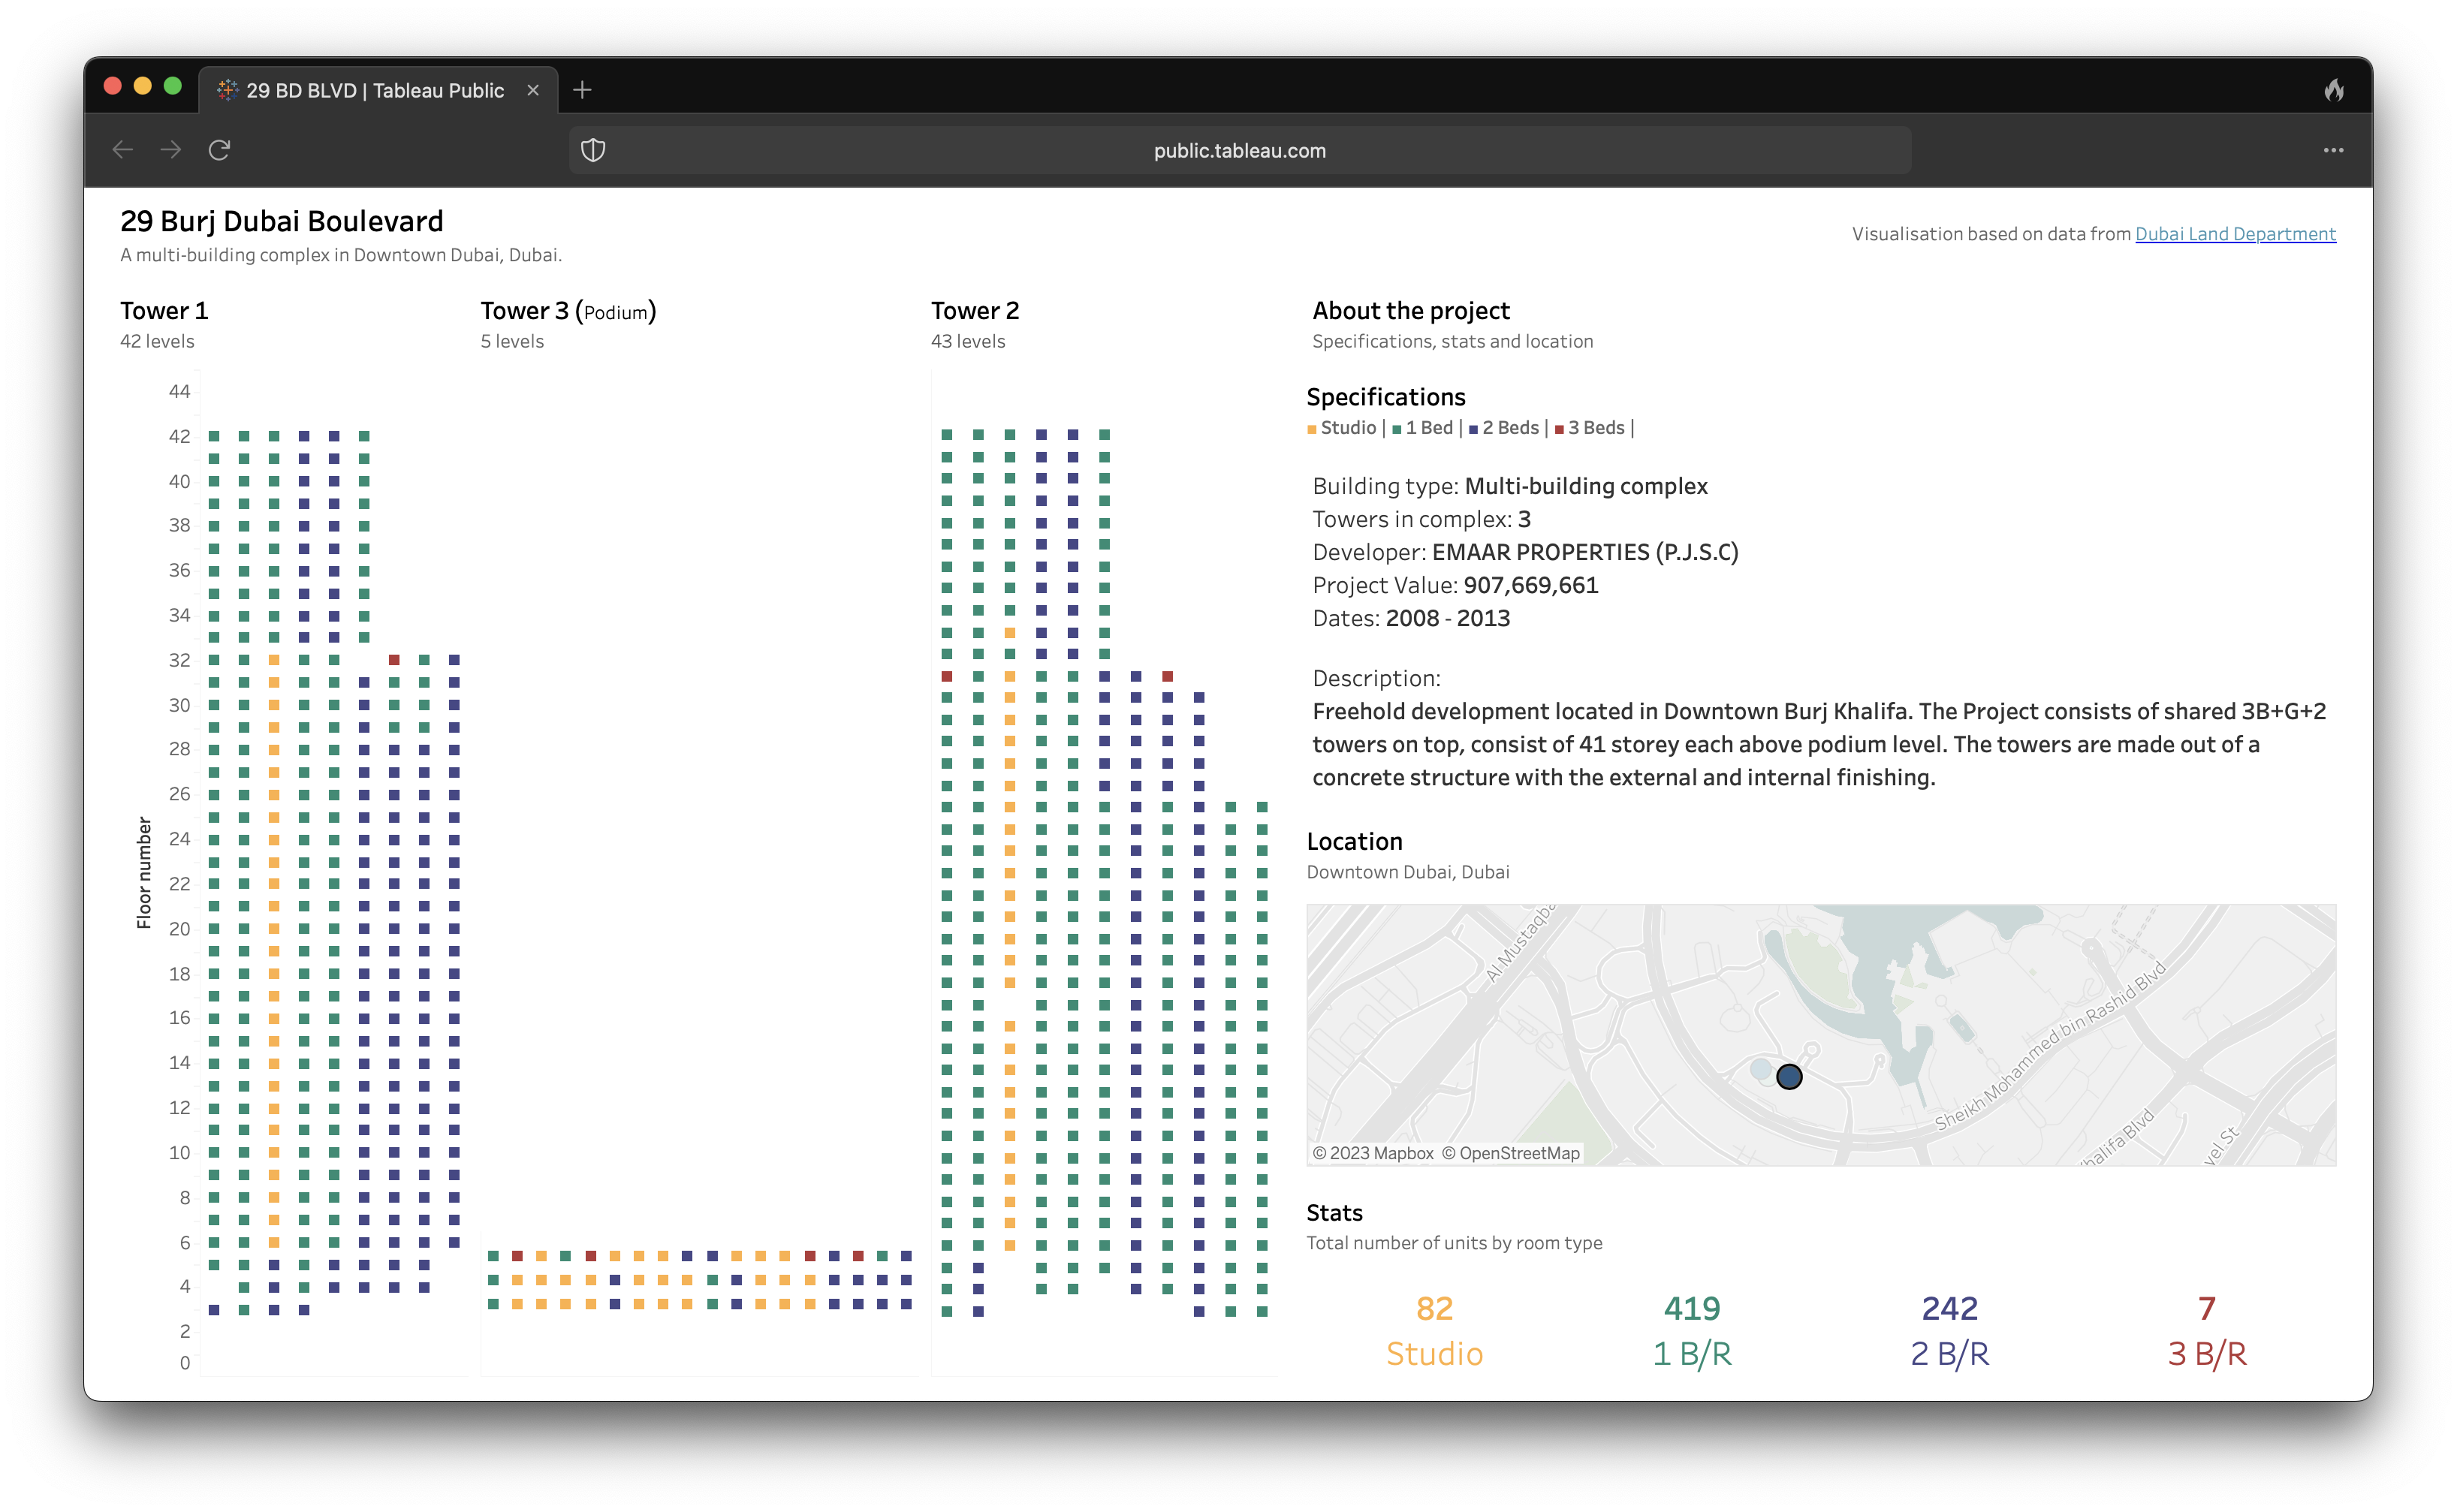
This project showcases a visualisation of 29 BD BLVD, built on data from the Dubai Land Department. It features an interactive, user-friendly dashboard hosted on Tableau's public server. It gives details about complex towers and a clear description of the project by EMAAR PROPERTIES.
Description
Dashboard provides a closer look at the 29 BD BLVD project in Dubai. This dashboard has two parts: one part for the towers and another part for the project description.
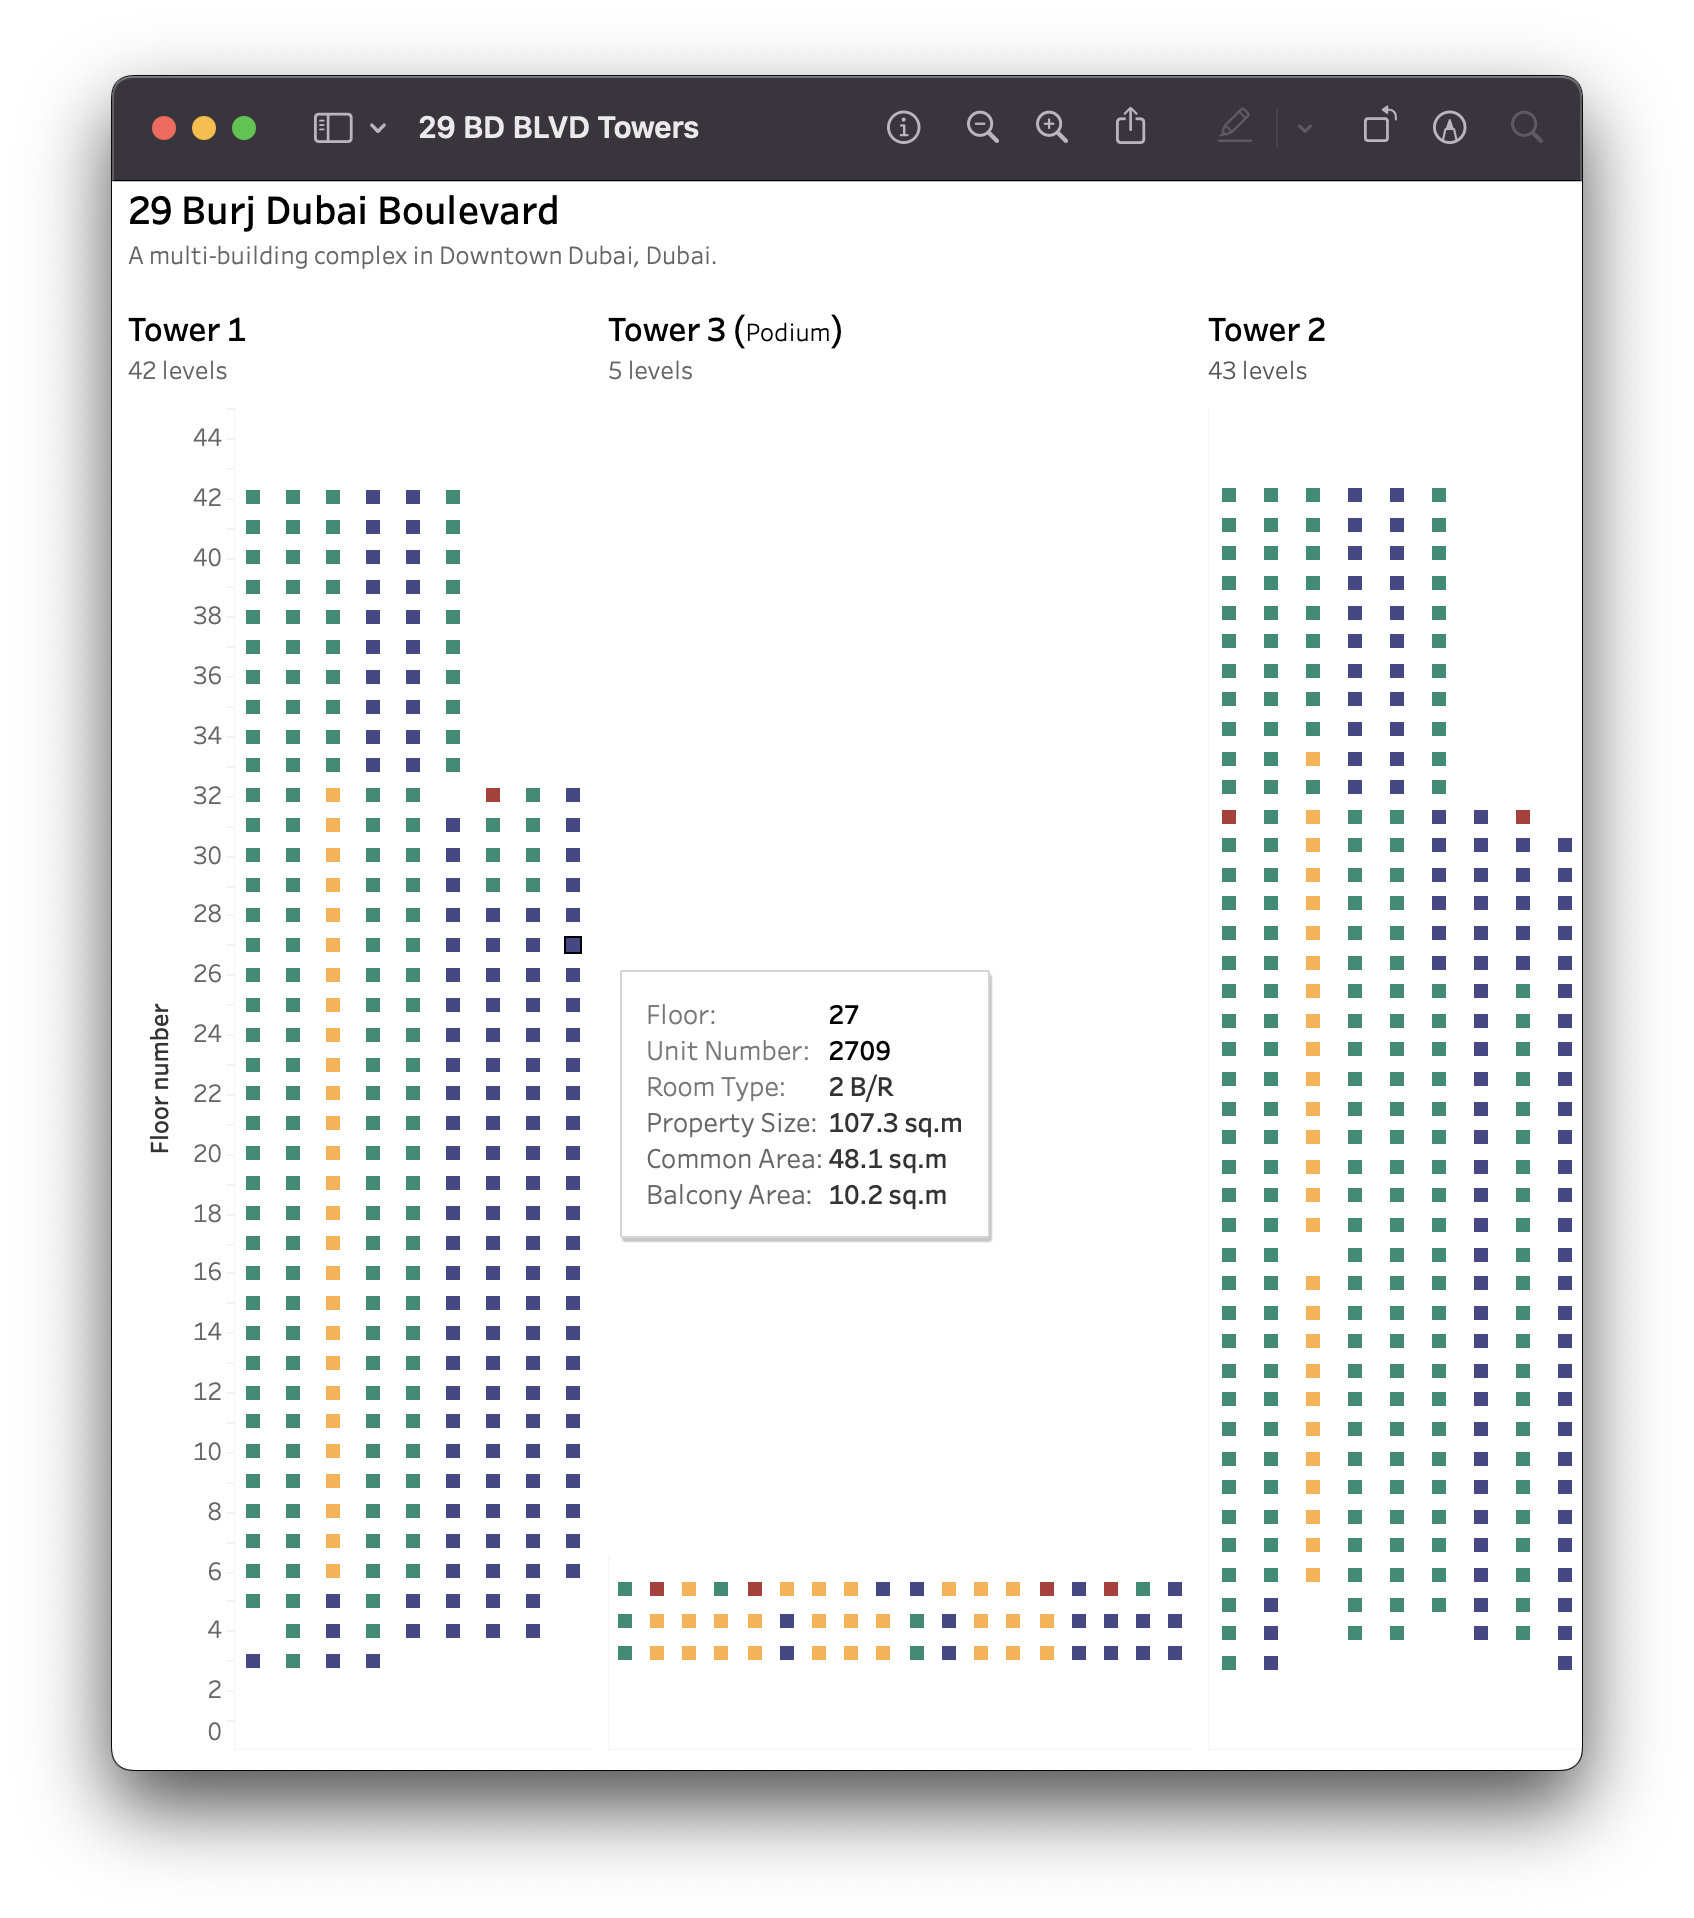
The towers section uses colors to show where different types of housing units (like apartments or villas) are located in each tower. Each color stands for a different type of unit. So, if you're looking for a two-bedroom apartment, just look for its color on the dashboard. If you hover your mouse over any colored square, a box will pop up to give more details about that unit.
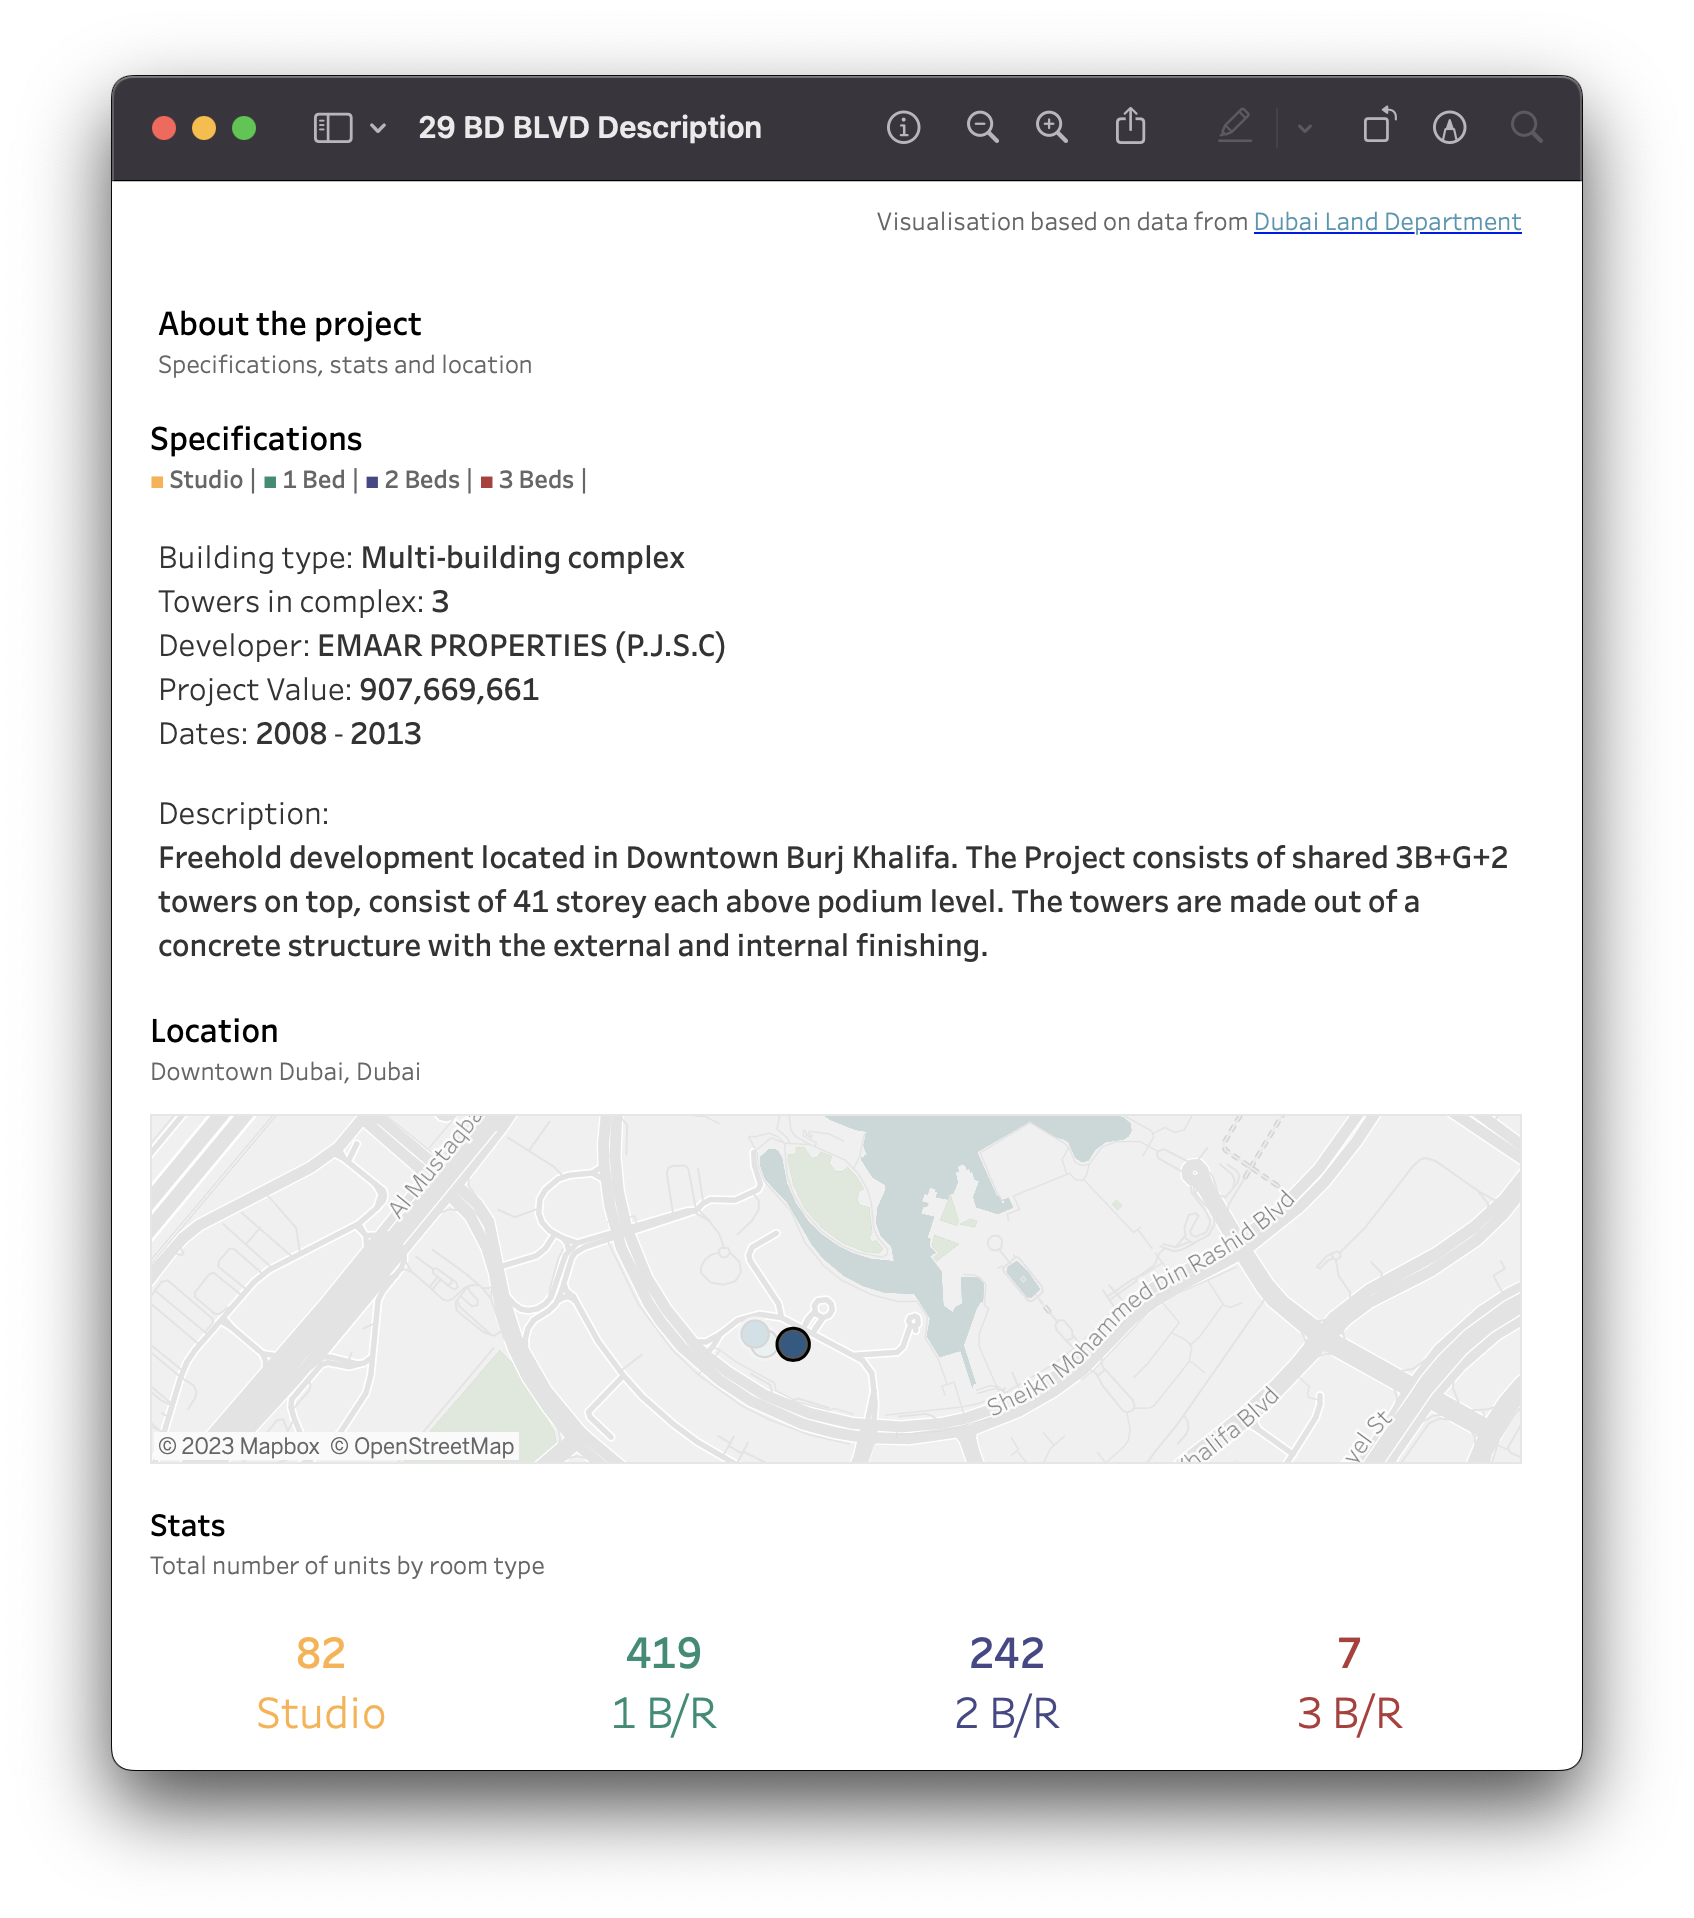
The description section explains the colors used in the towers section and also gives more information about the 29 BD BLVD project. This includes details like how many buildings are in the complex, when they were built, and where they are located on an interactive map.
In short, this dashboard is a simple, interactive tool that helps you understand the 29 BD BLVD project in Dubai. It provides information about different types of housing units in the towers and also gives a bird's eye view of the project's location on a map. This makes it a handy tool for anyone interested in the Dubai rental market.