
REMA Dubai Dashboard
Project details
REMA Dubai on TableauDecember 2022
Data analysis, Exploratory Data Analysis, Data Visualization, Dashboard, Dubai Rental Market, Tableau
Brief description
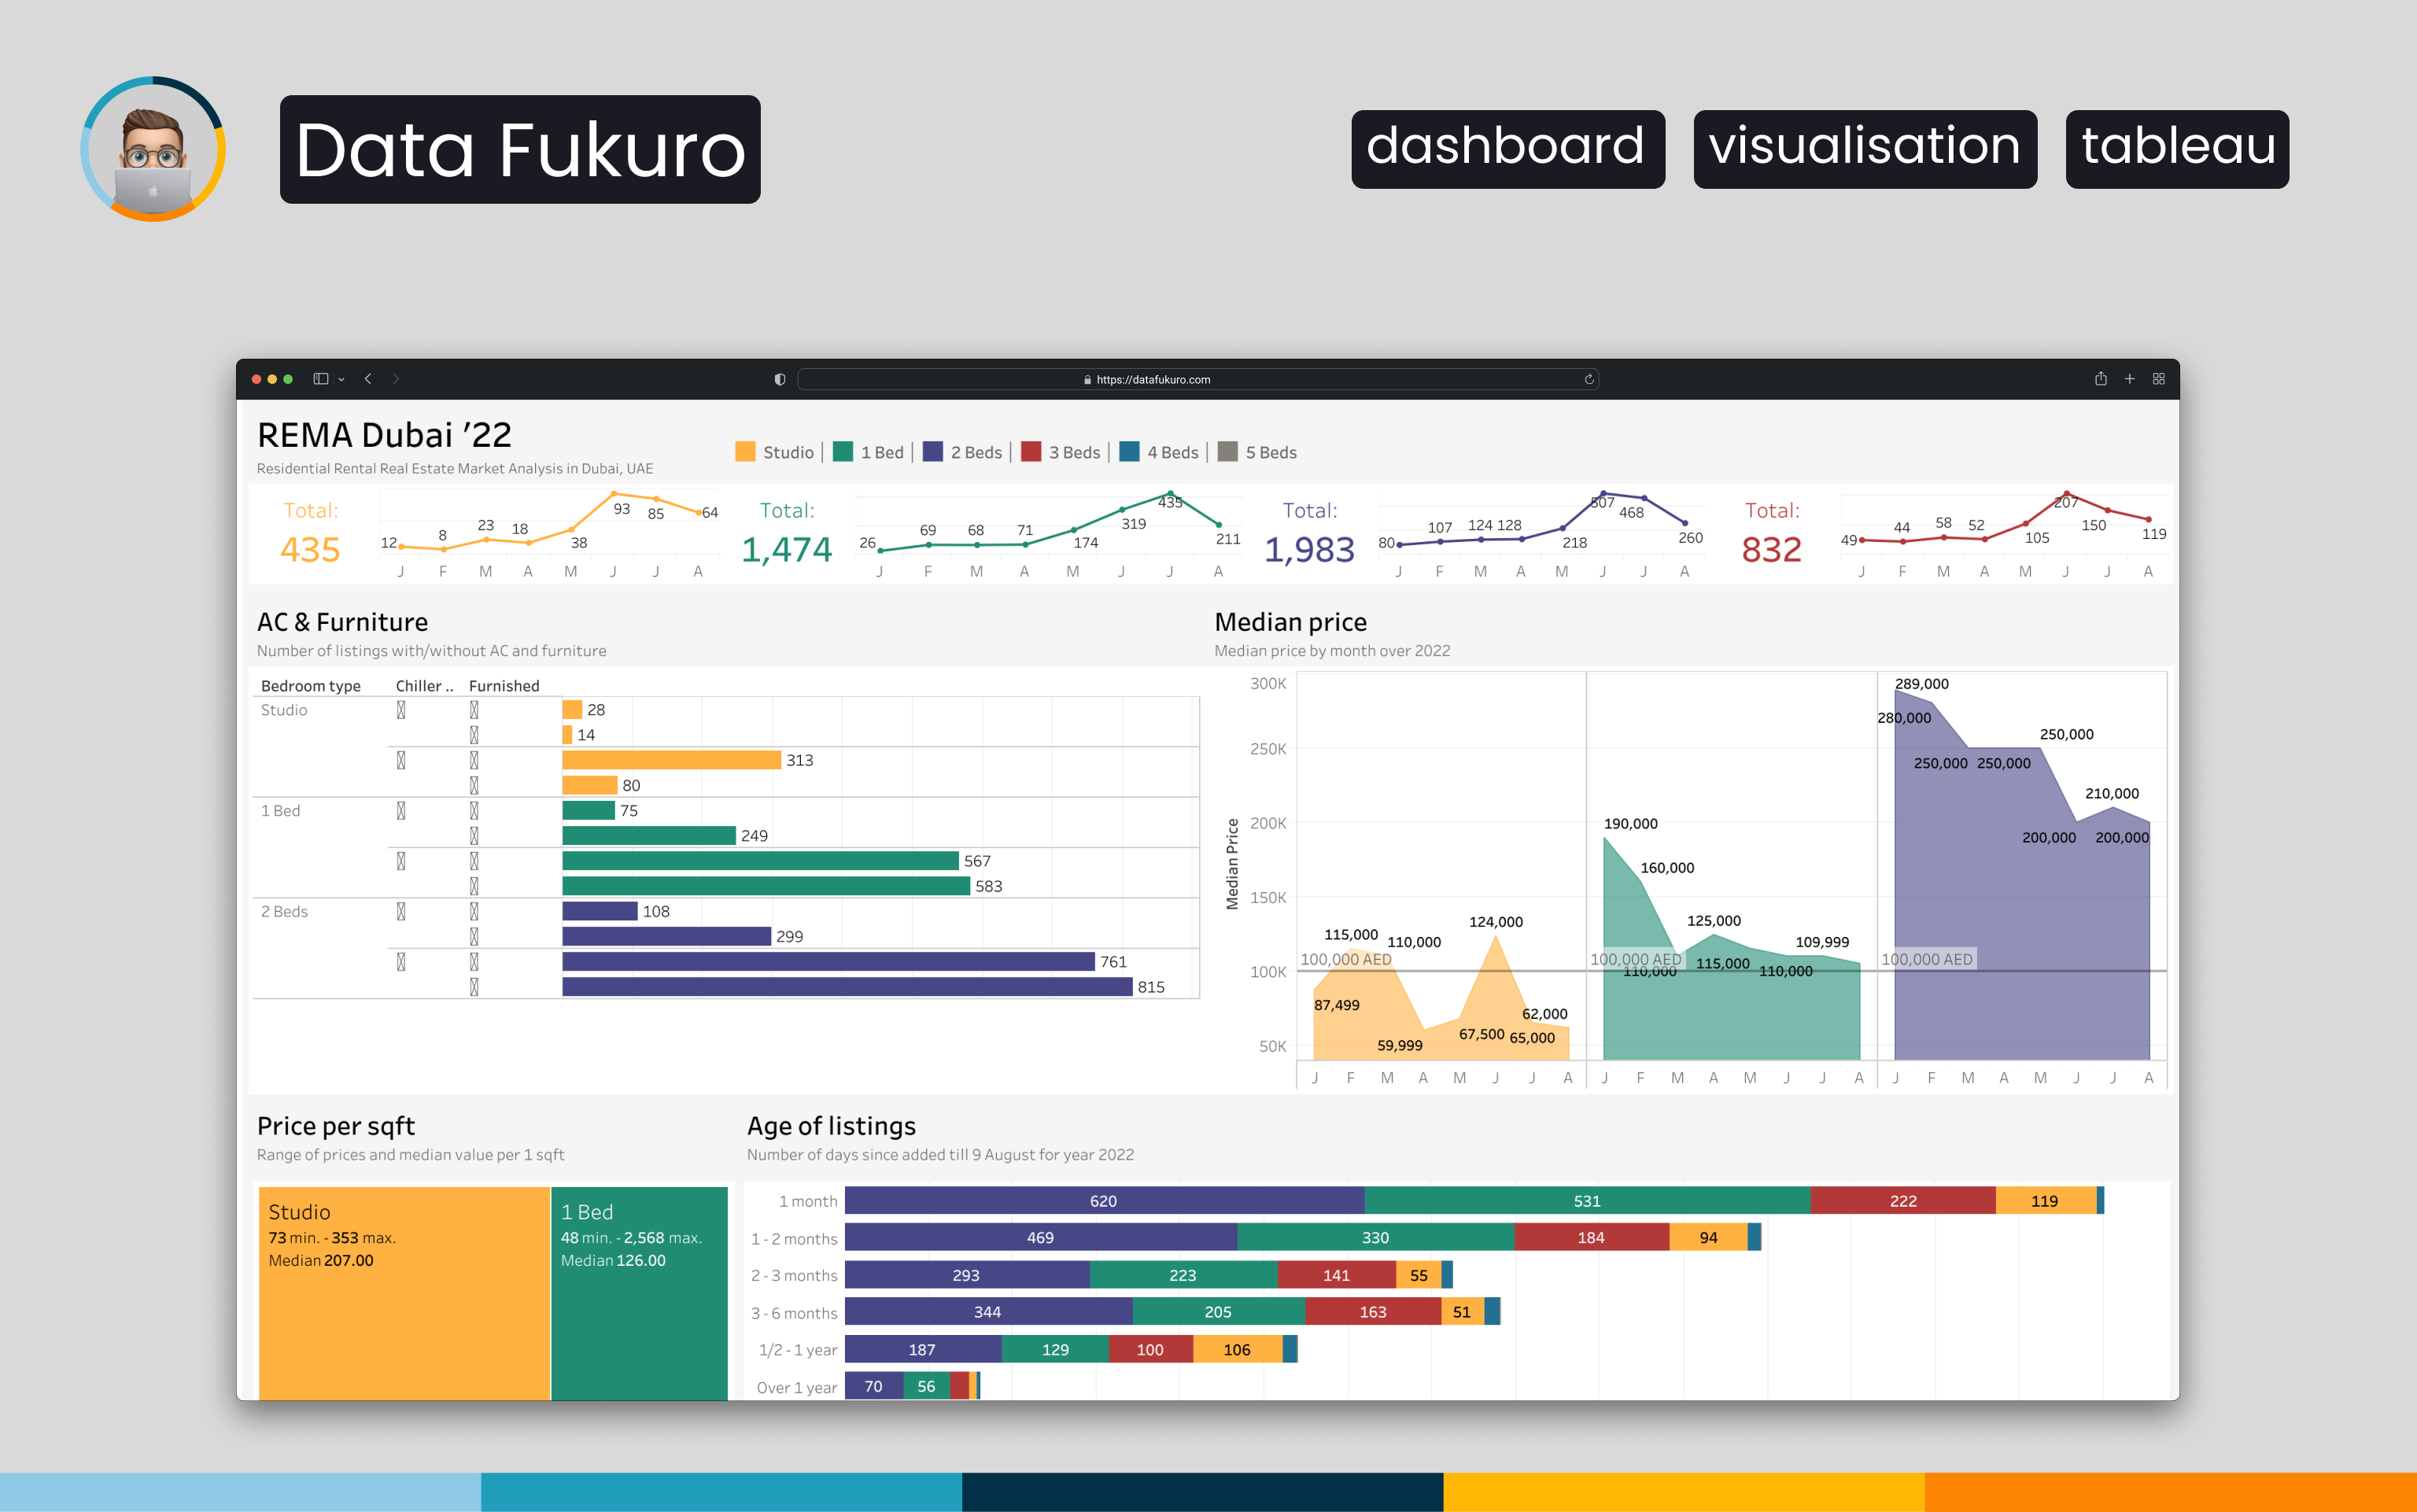
The REMA Dubai Dashboard is a real estate market analysis project that includes a Tableau visualization dashboard based on a dataset of over 4,800 rental listings in Dubai's Downtown and DIFC areas. The dashboard features color-coded apartments by room type, median prices, and various features such as AC and furnishings.
Description
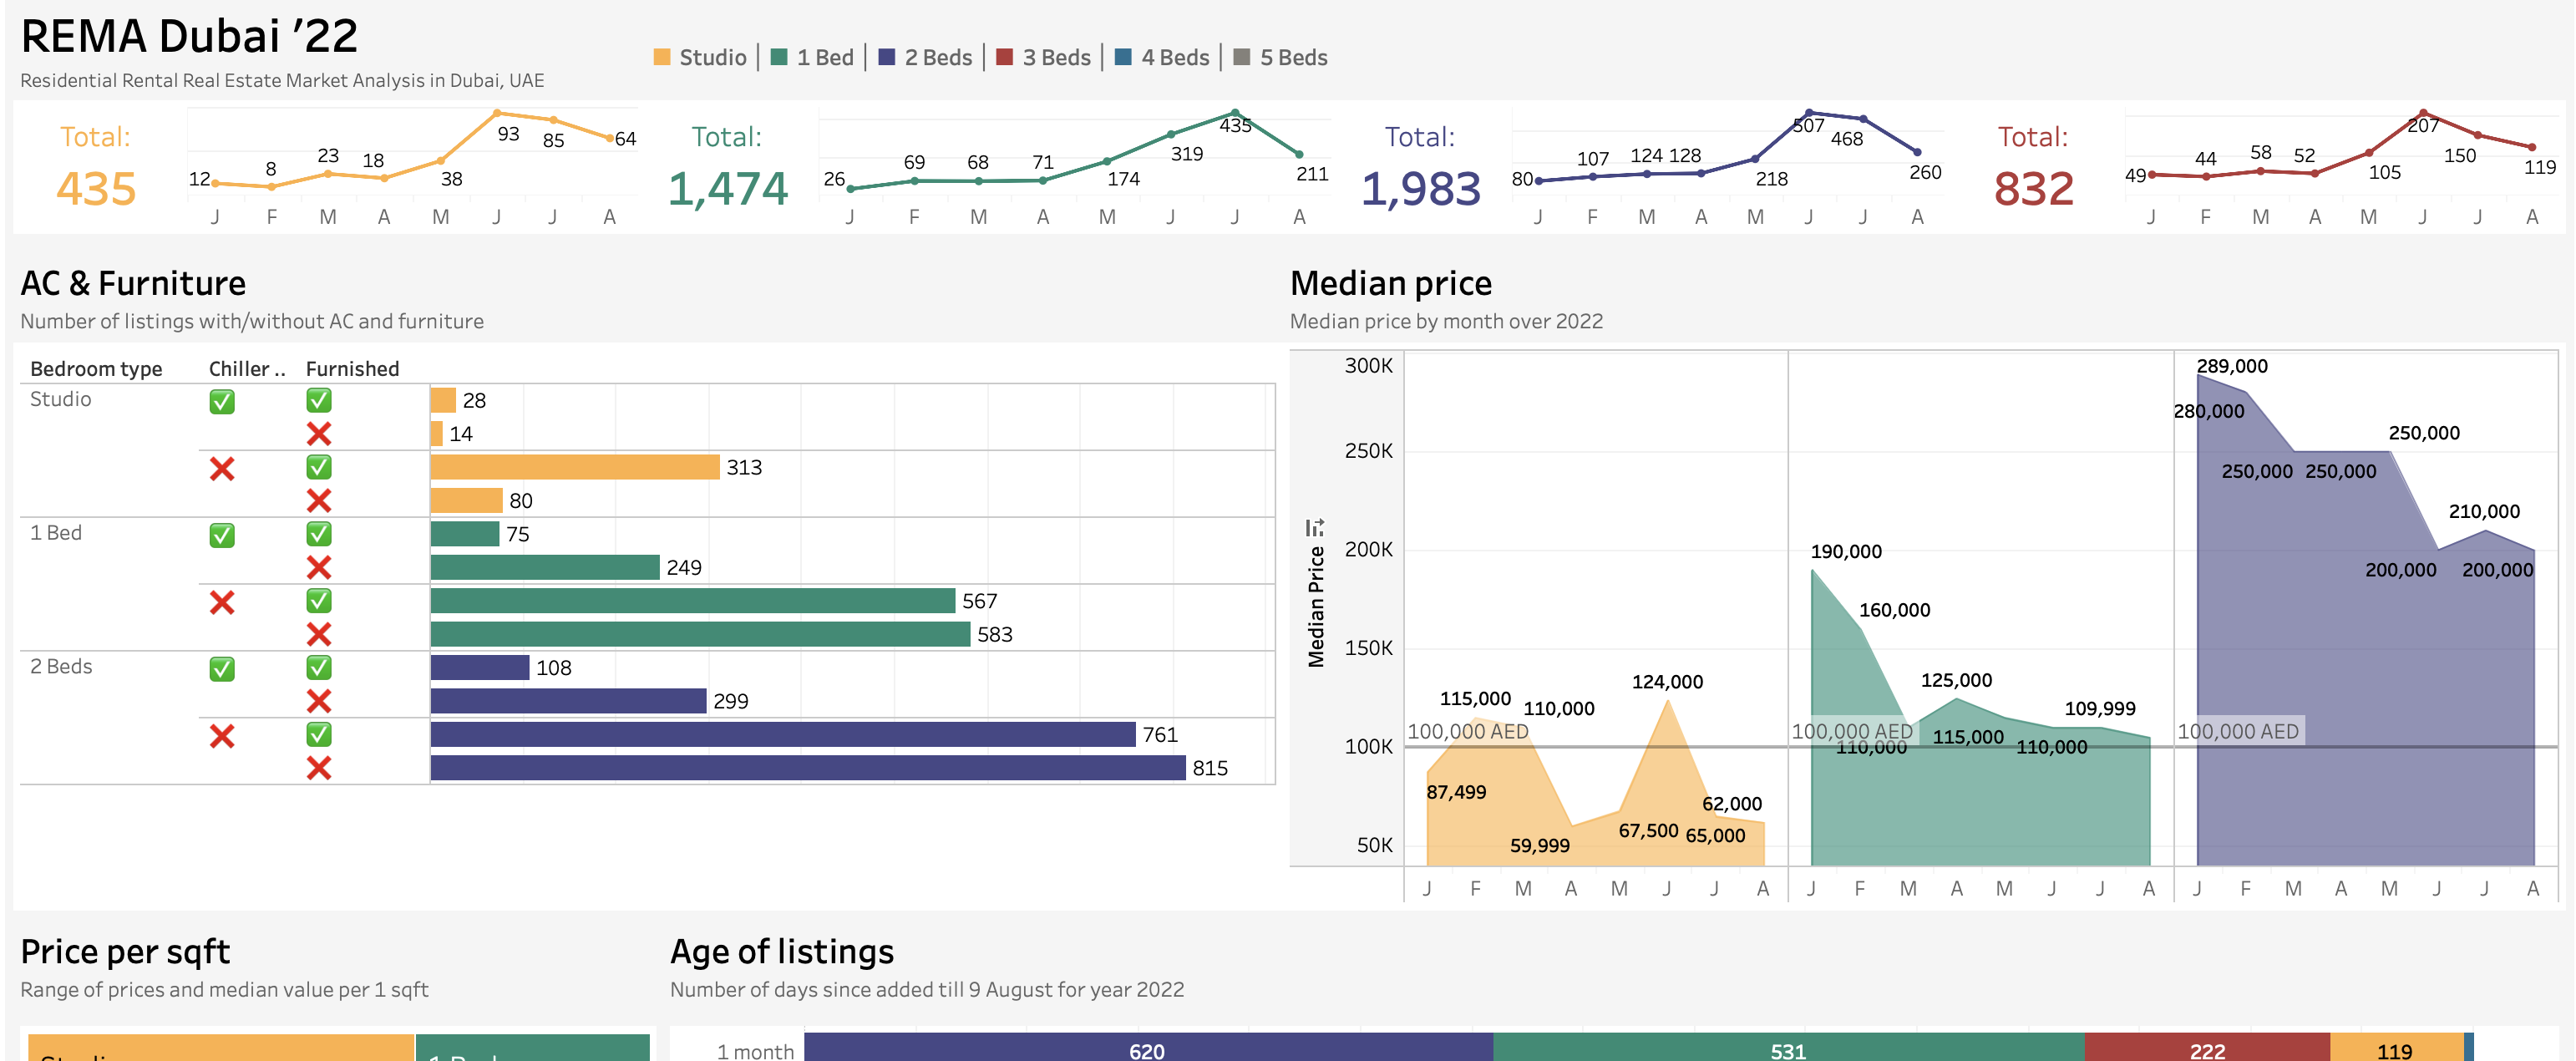
At the core of the dashboard, the apartments are color-coded by room type, enabling users to swiftly identify the distribution of studio apartments, one-bedroom, two-bedroom apartments, and beyond. This feature enhances the user's understanding of the rental landscape, giving them a snapshot of the type of accommodations available in these areas.
Moreover, the dashboard presents detailed statistics on the median prices of these apartments. It's not just about the room numbers; the dashboard goes a step further by revealing the influence of various features on these prices. With a focus on amenities such as air conditioning and furnishings, users can ascertain how these elements contribute to the overall rental price, thus aiding their decision-making process.
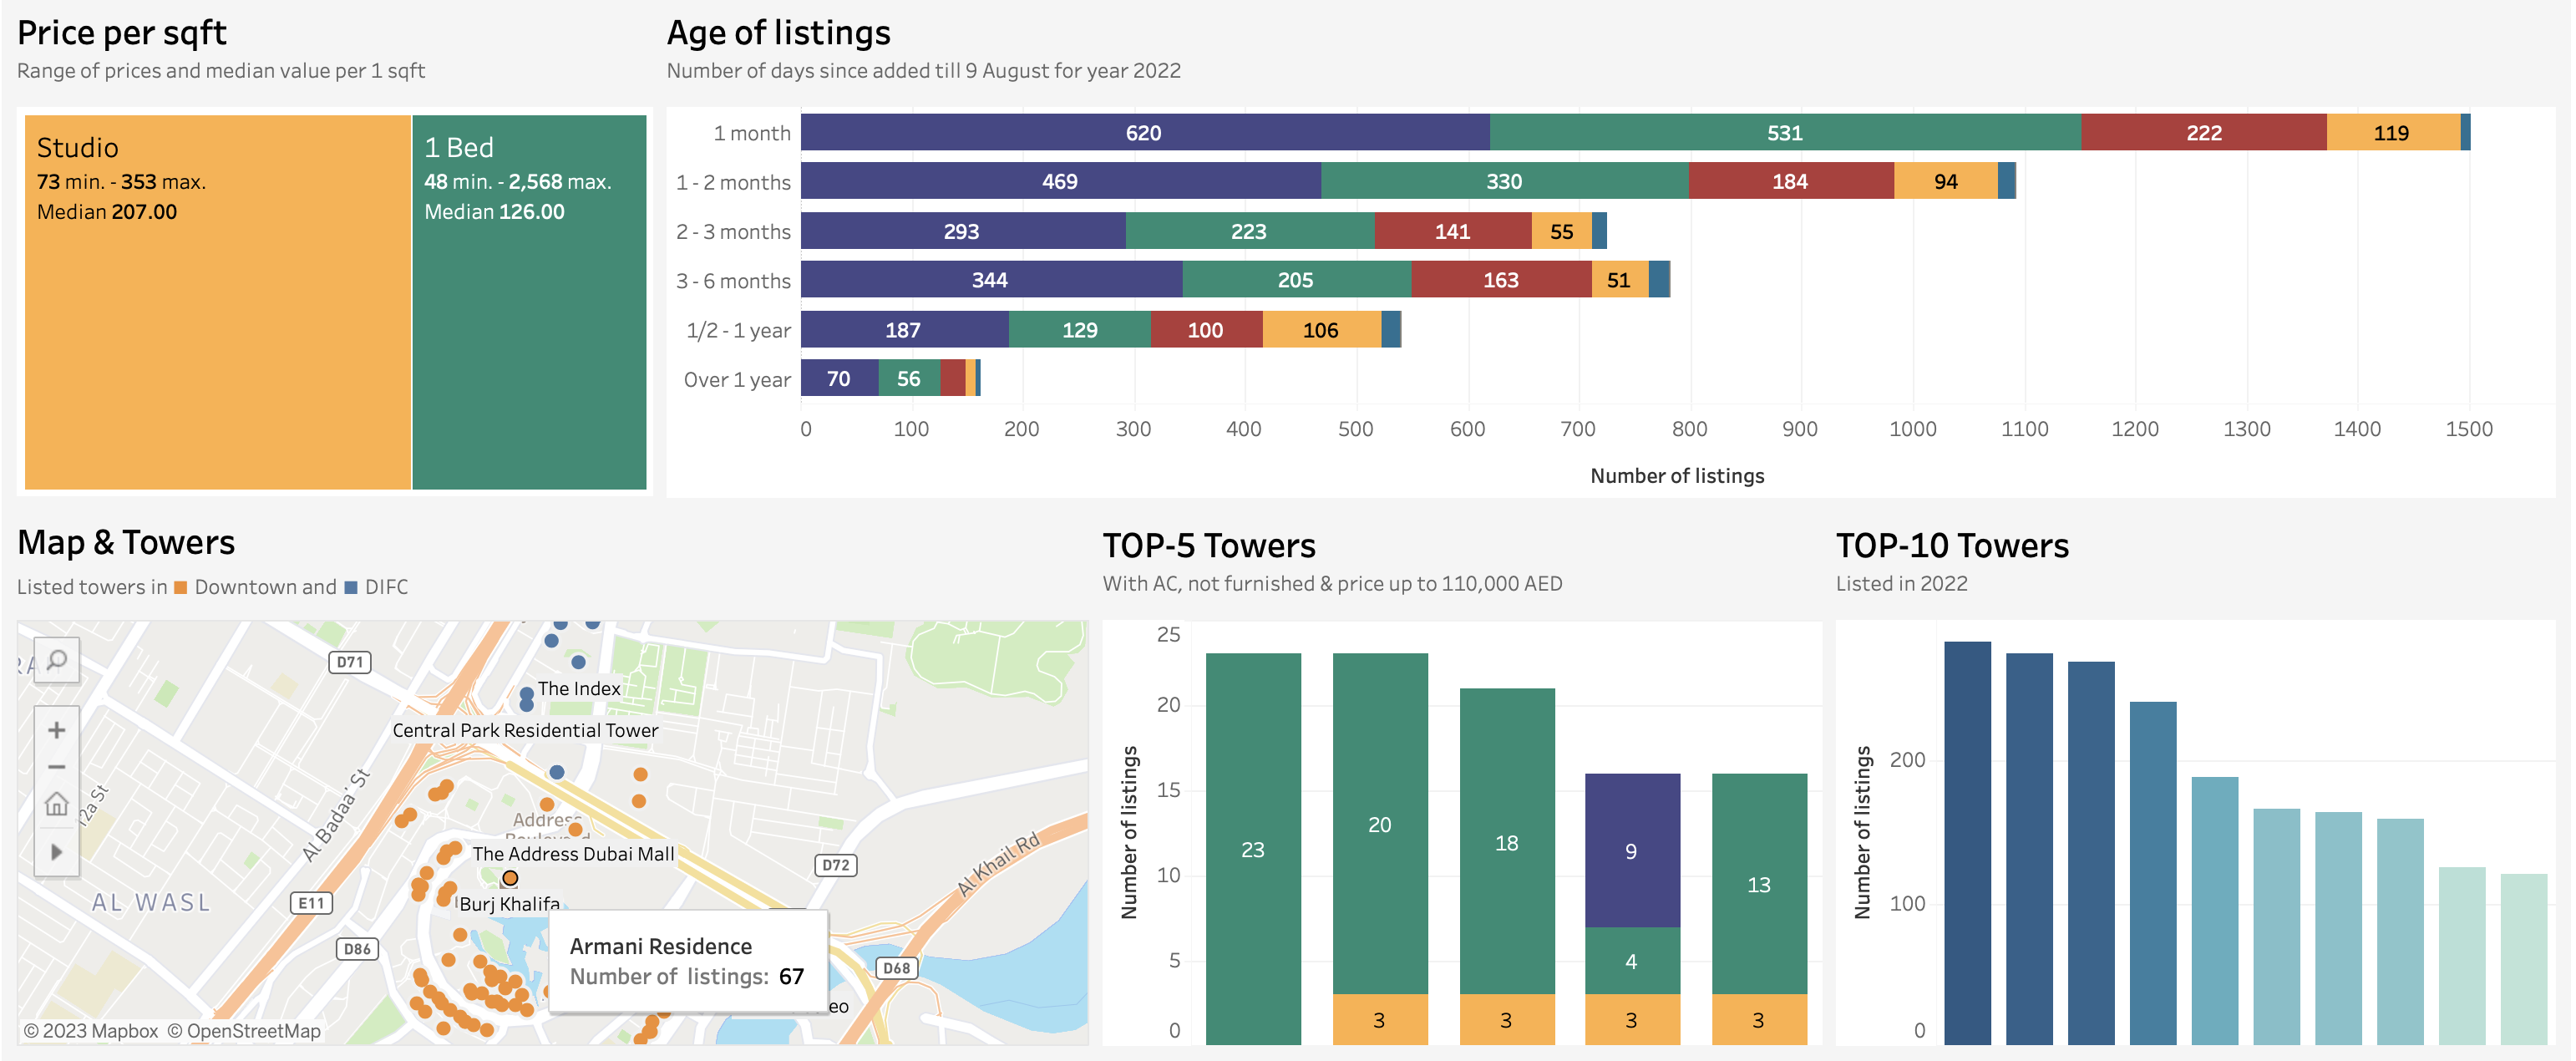
Adding a geospatial dimension to the data, the dashboard also showcases an interactive map of buildings in the Downtown and DIFC districts. The locations of these buildings are marked, providing users with a spatial context of the Dubai rental market. This feature is particularly useful for those unfamiliar with Dubai's geography or for those interested in proximity to landmarks or facilities.