
The UAE Population Dashboard
Project details
Project on TableauJanuary 2023
Data Visualization, Tableau, Demographic Analysis, Interactive Charts, Population Study
Brief description
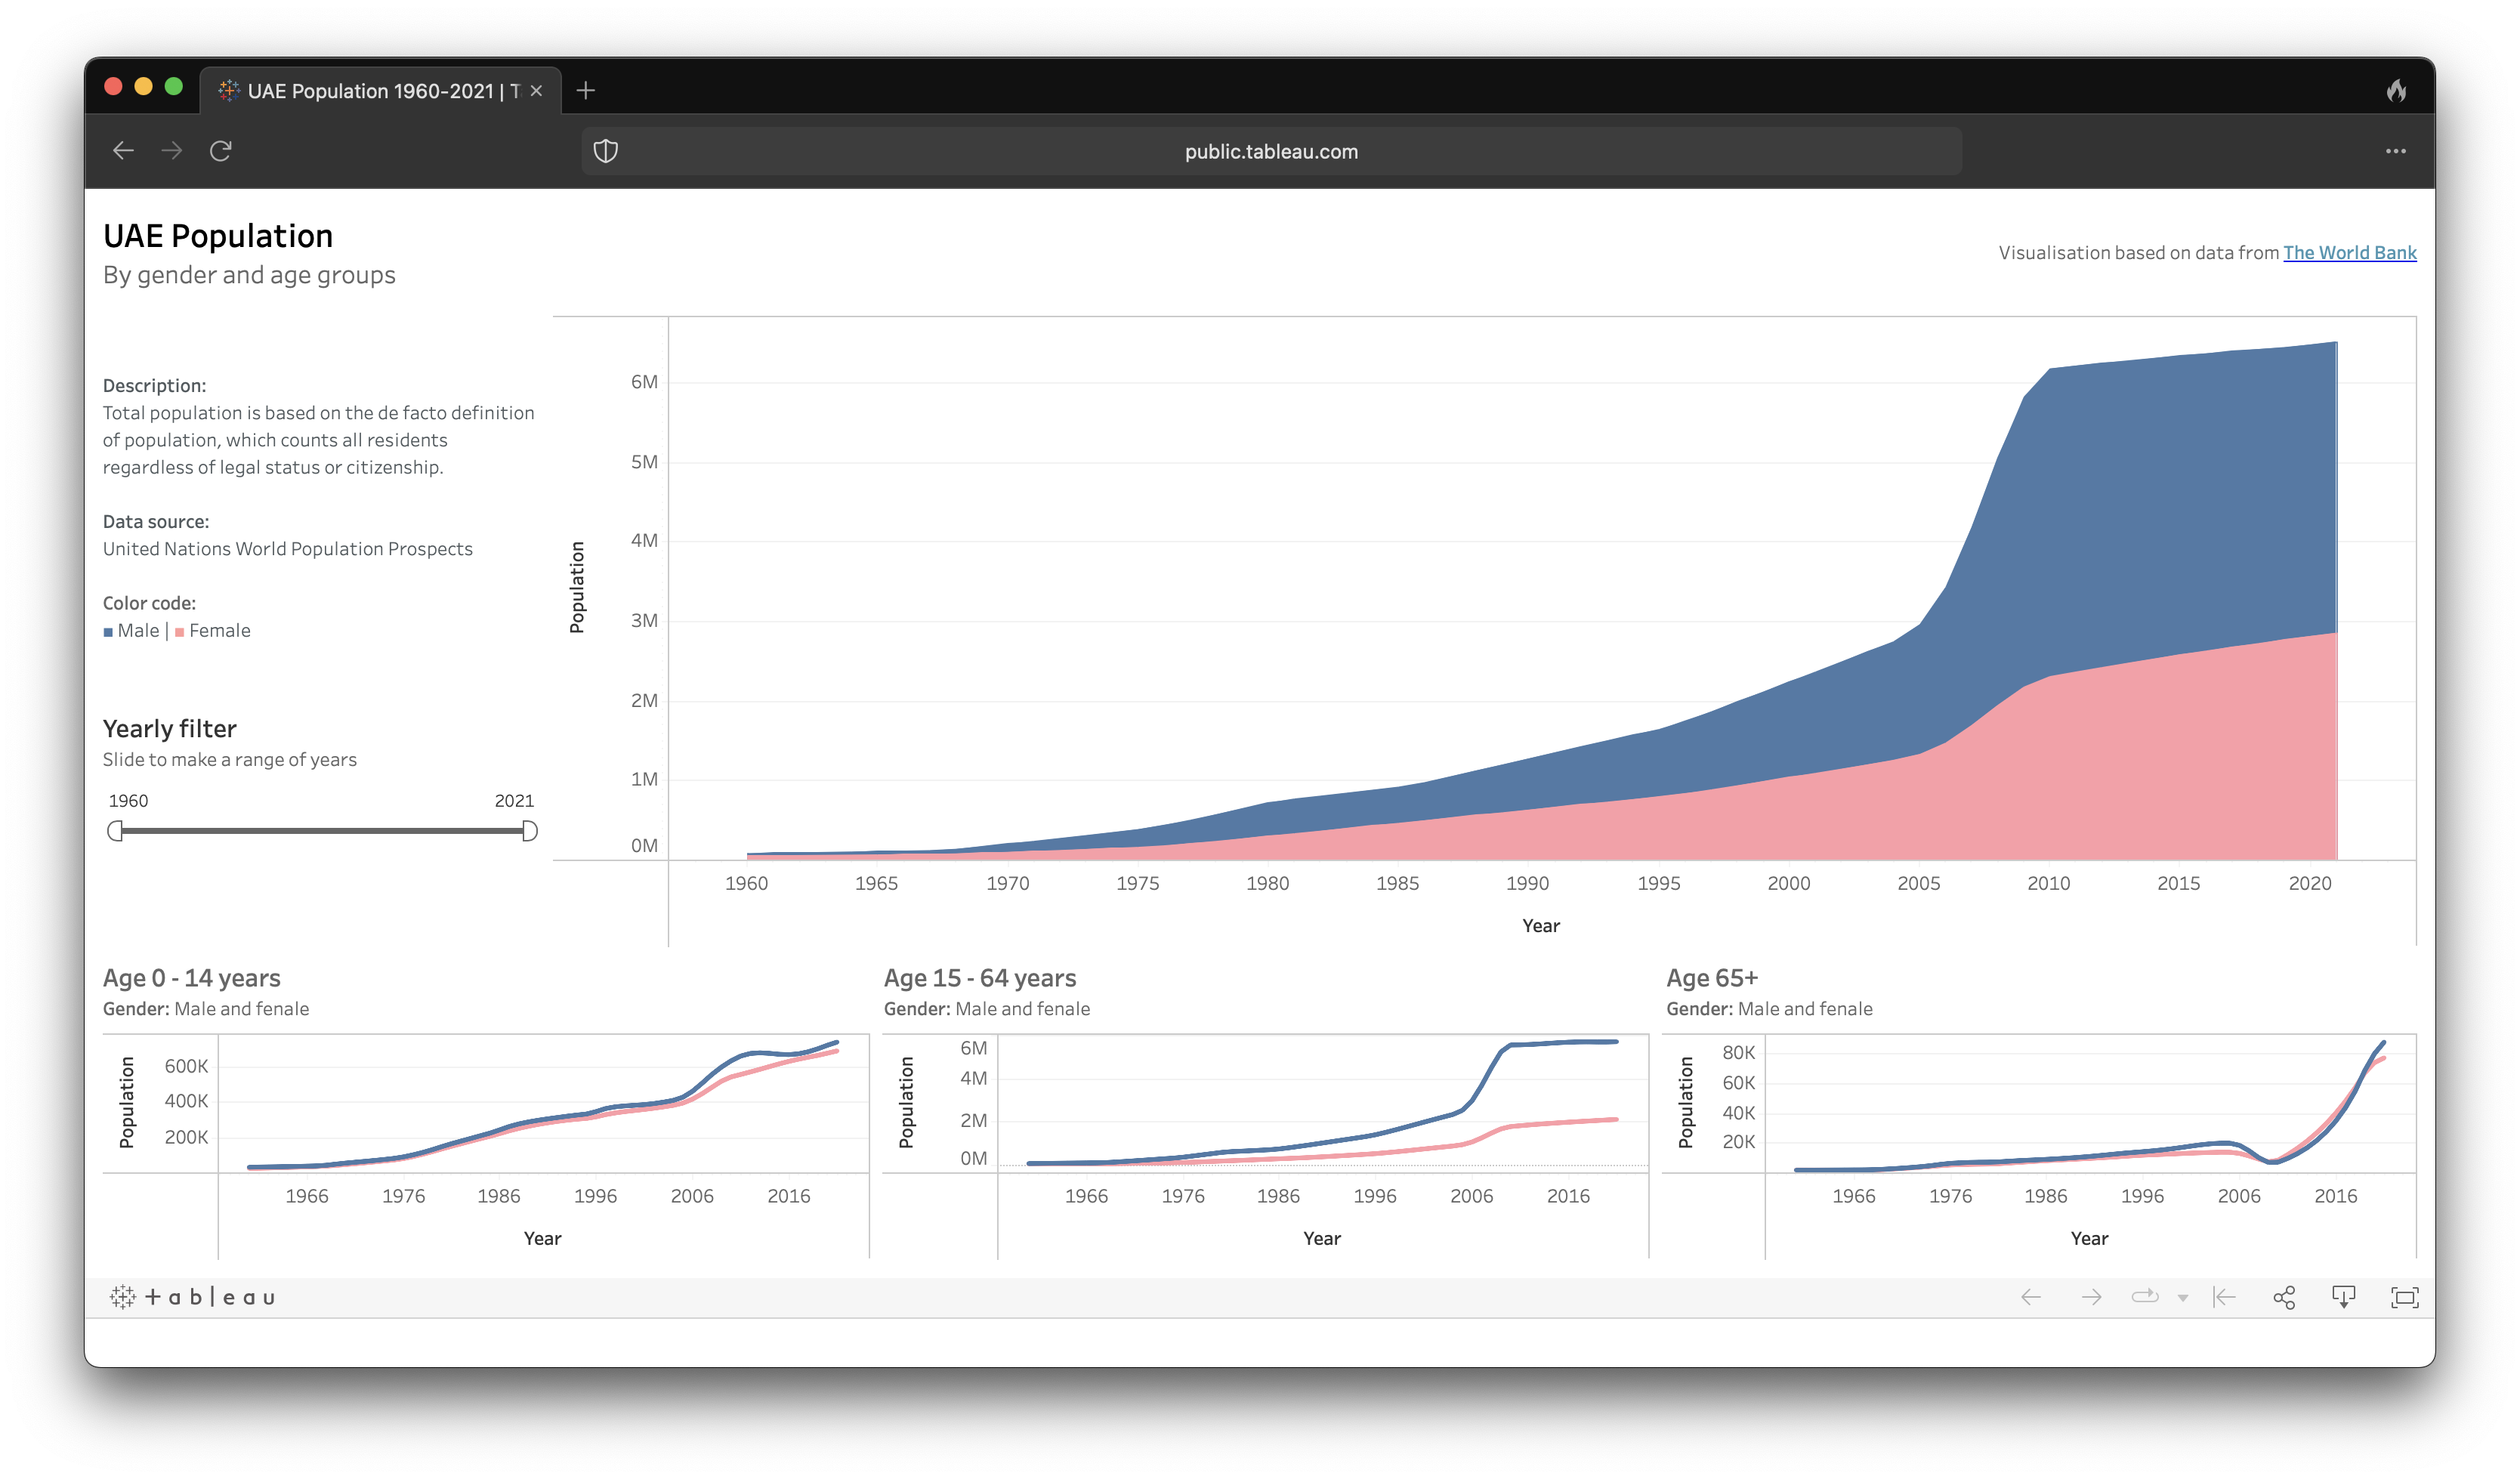
The UAE Population Dashboard is a Tableau-based tool, showcasing the population dynamics of the United Arab Emirates (UAE) from 1960 to 2021, segmented by age and gender.
Description
The UAE Population Dashboard, utilizes the power of Tableau to represent population data from the United Nations World Population Prospects in an interactive format. The dashboard hosts a main chart that displays total population statistics, using a de facto definition of population, counting all residents irrespective of their legal status or citizenship.
This main chart offers interactivity that allows users to adjust the year range to view data across different time frames. The representation of genders is facilitated through two distinct colors, making visual comparison and understanding seamless.
Additional charts located at the bottom of the dashboard segment the population into three age groups: 0-14 years, 15-64 years, and 65+. These line charts provide an at-a-glance overview of population trends across different age groups over the chosen time frame.