Project details:
This Tableau dashboard visualizes rental market data from Dubai’s Downtown and DIFC districts. Users can explore prices by room type, compare median rents, view feature-driven price differences and analyze spatial patterns across major towers. The tool provides a clear, interactive overview of the rental landscape and supports smarter property research.
Description
Business Context & Problem
Dubai’s rental market is highly segmented, with strong differences across neighbourhoods, building types and amenities. Raw data can be overwhelming, making it difficult for renters, investors or analysts to compare listings effectively. This dashboard transforms a scraped dataset of apartments into an intuitive visual tool that highlights the most important patterns in the market.
Data & Analytical Approach
PThe underlying dataset includes more than 4,800 rental listings from Downtown and DIFC. After cleaning and structuring the data in the earlier analysis project, key features such as room type, price, size, amenities and tower location were prepared for visualization. Price per m², median values and aggregated counts were calculated to support comparative insights.
Visualization & Interaction Design
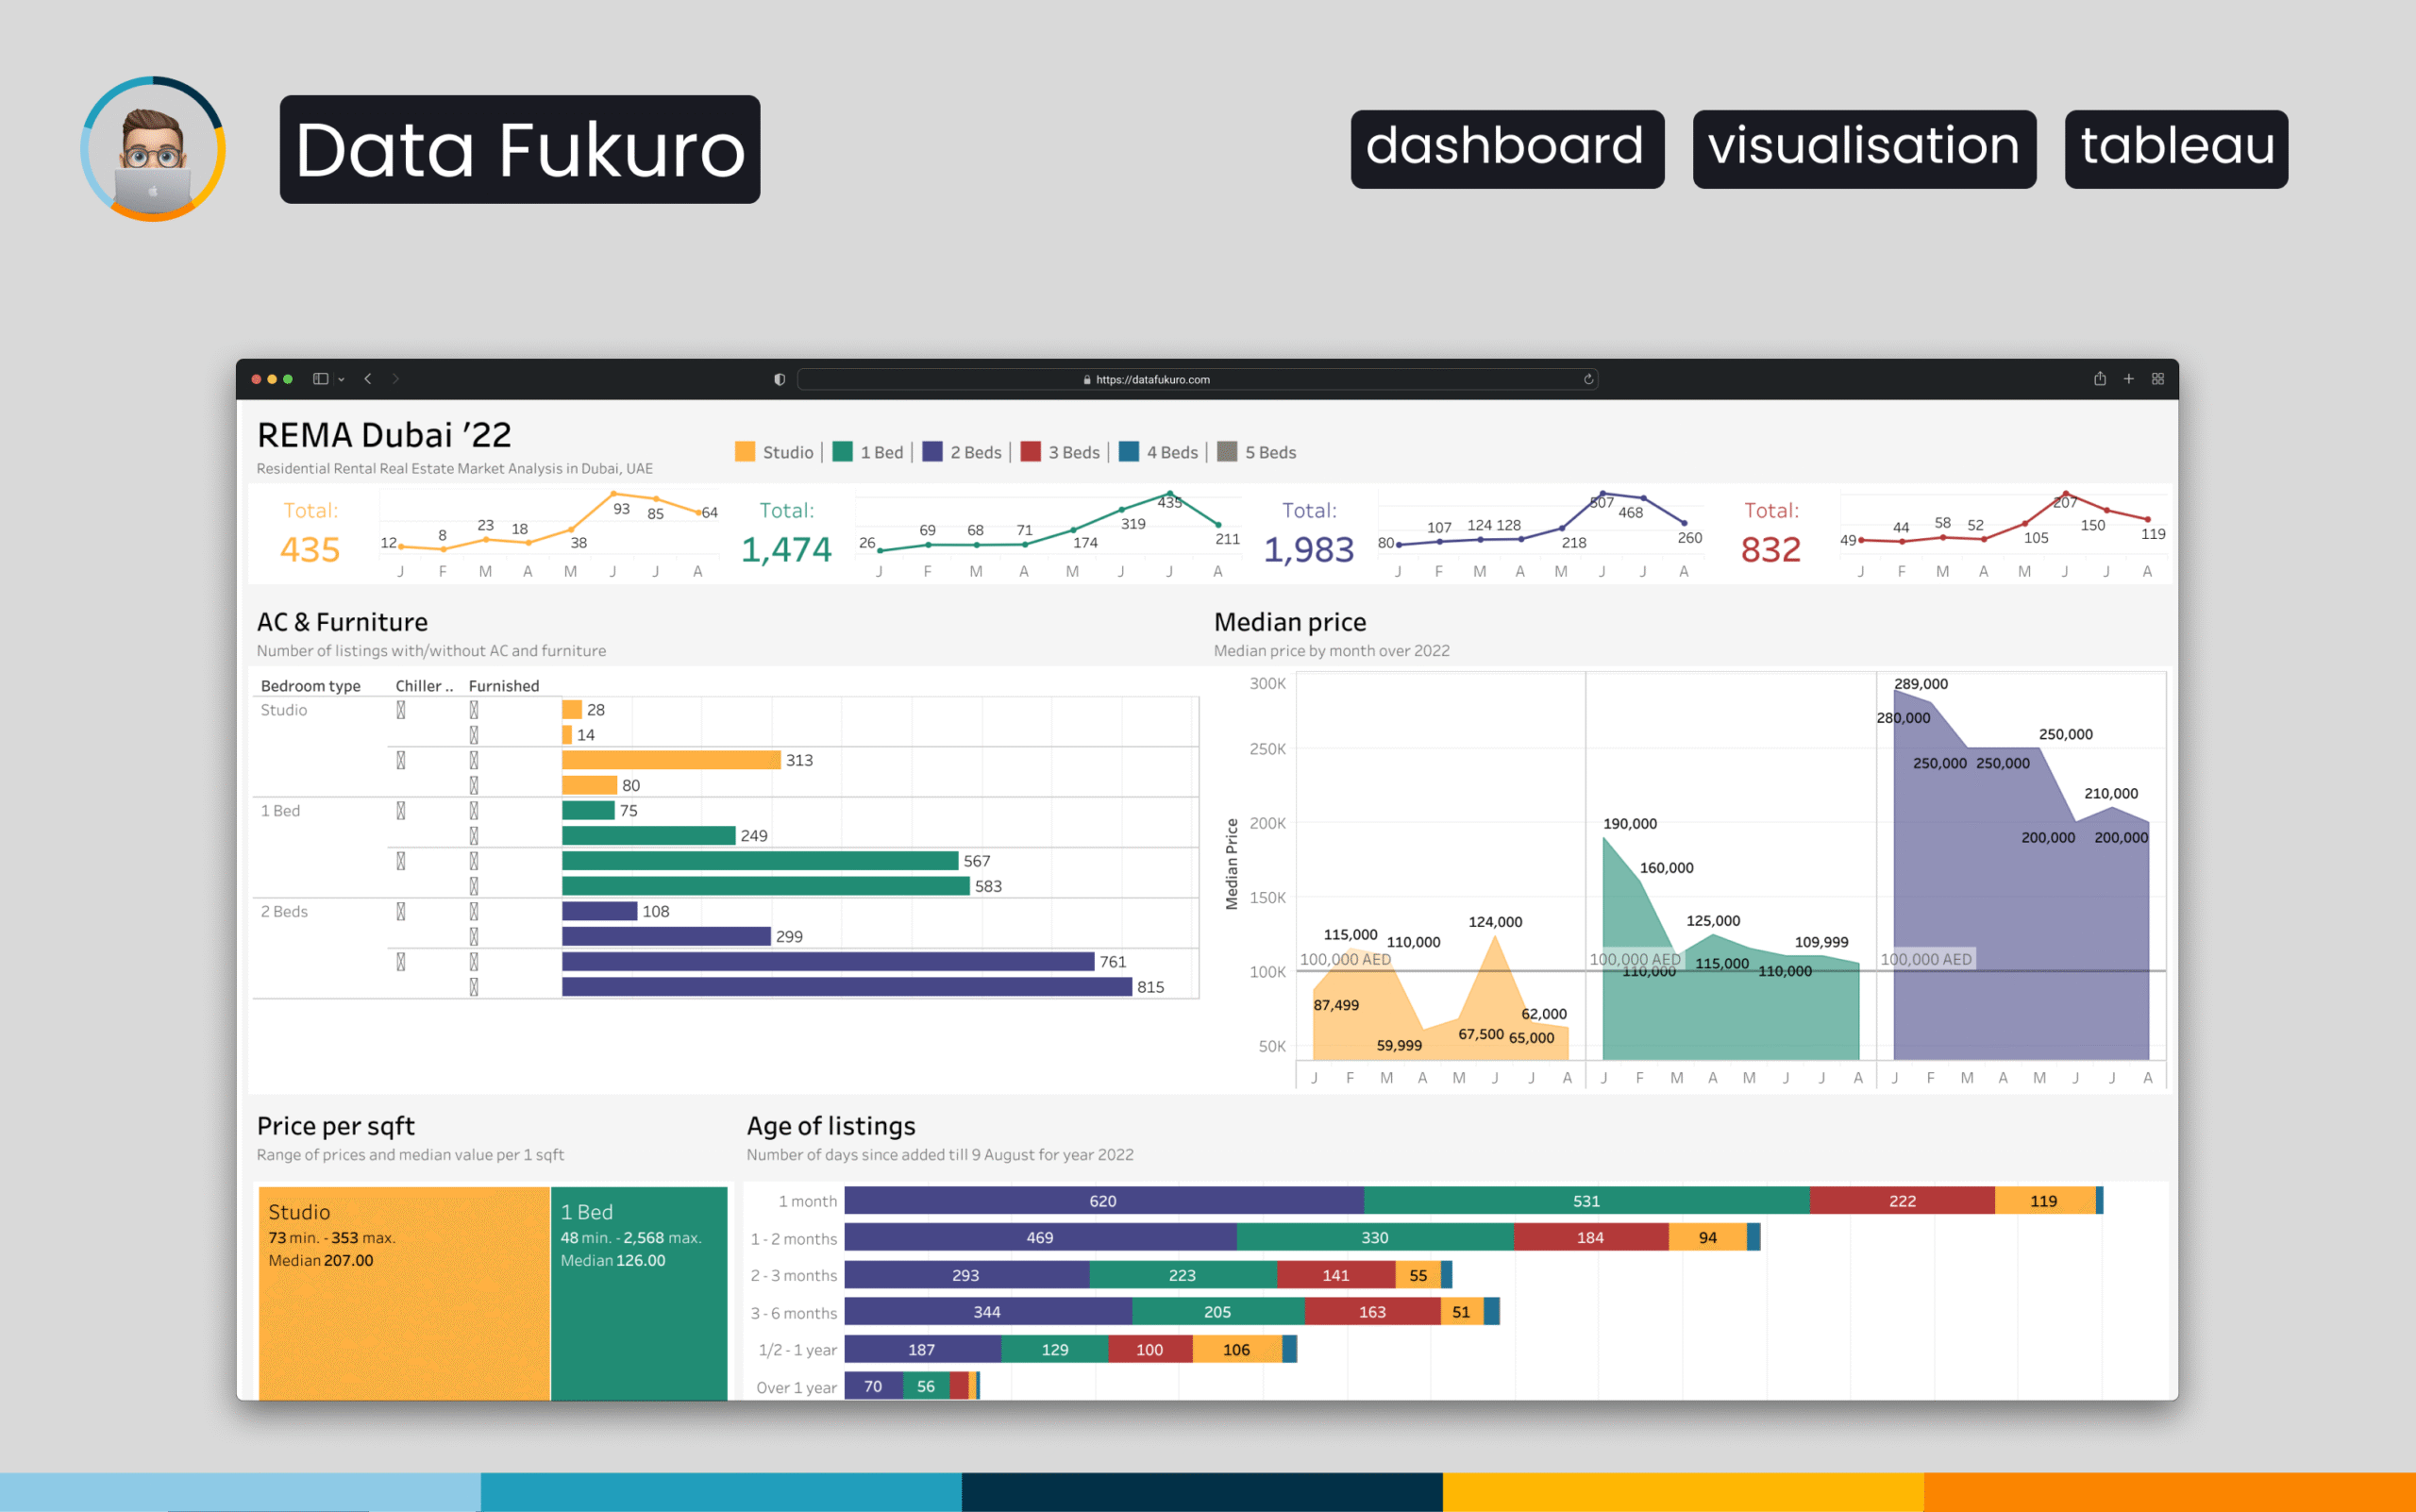
The dashboard is built around three main analytical components:
- Room Type Distribution
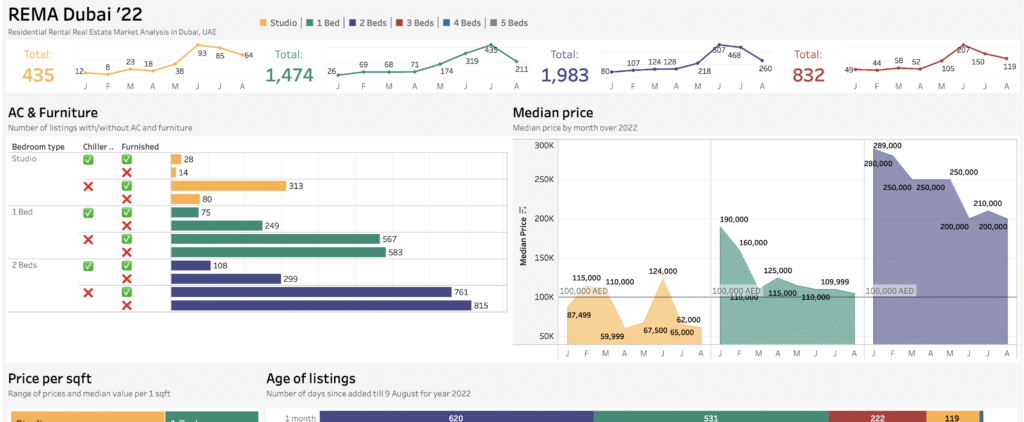
Apartments are colour-coded by room category (studio, 1-bed, 2-bed, etc.), enabling quick visual comparison of supply across both districts. - Price Insights & Amenities
Median prices are shown alongside the influence of features like AC and furniture. Users can see how these attributes shift price ranges and contribute to overall rental value. - Geospatial Context
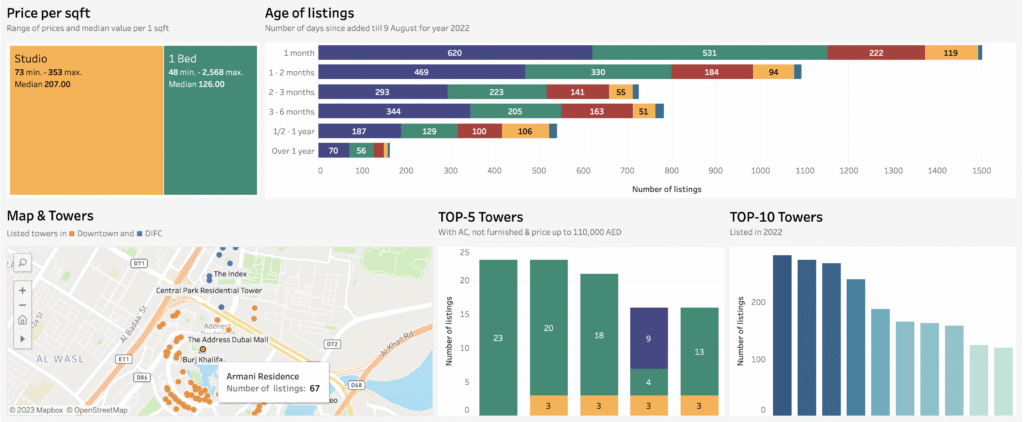
An interactive map highlights buildings across Downtown and DIFC, helping users understand spatial clusters, tower prominence and proximity to major landmarks.
Clear colour schemes, aligned axes and consistent filters ensure smooth exploration without overwhelming the viewer.
Key Insights & Final Recommendations
PThe dashboard reveals that Downtown tends to command higher median prices, while DIFC shows notable variation between towers. Room type strongly influences price levels, and amenities such as furniture or AC often explain additional price differences.
The map view helps identify high-demand buildings and visually connect price information with location — particularly useful for new residents or investors exploring unfamiliar areas.
Overall, the dashboard offers an accessible, interactive way to navigate Dubai’s rental market from multiple angles, providing insights that would be difficult to obtain from raw listings alone.