-
Dubai Tenancy Lookup: Rental History & Property Insights
Dubai Tenancy Lookup is a Streamlit web app that lets users explore rental history and building details using their Ejari number. The tool aggregates open data from the Dubai Land Department, showing property information, past rental prices, building characteristics and location maps. It provides a clear overview of a unit’s rental trends and market context.
Project tags: Altair, API Integration, Caching, Data Cleaning, Data Engineering, Exploratory Data Analysis, Interactive Visualizations, Mapbox, Pandas, Streamlit, Web Application DevelopmentRead more: Dubai Tenancy Lookup: Rental History & Property Insights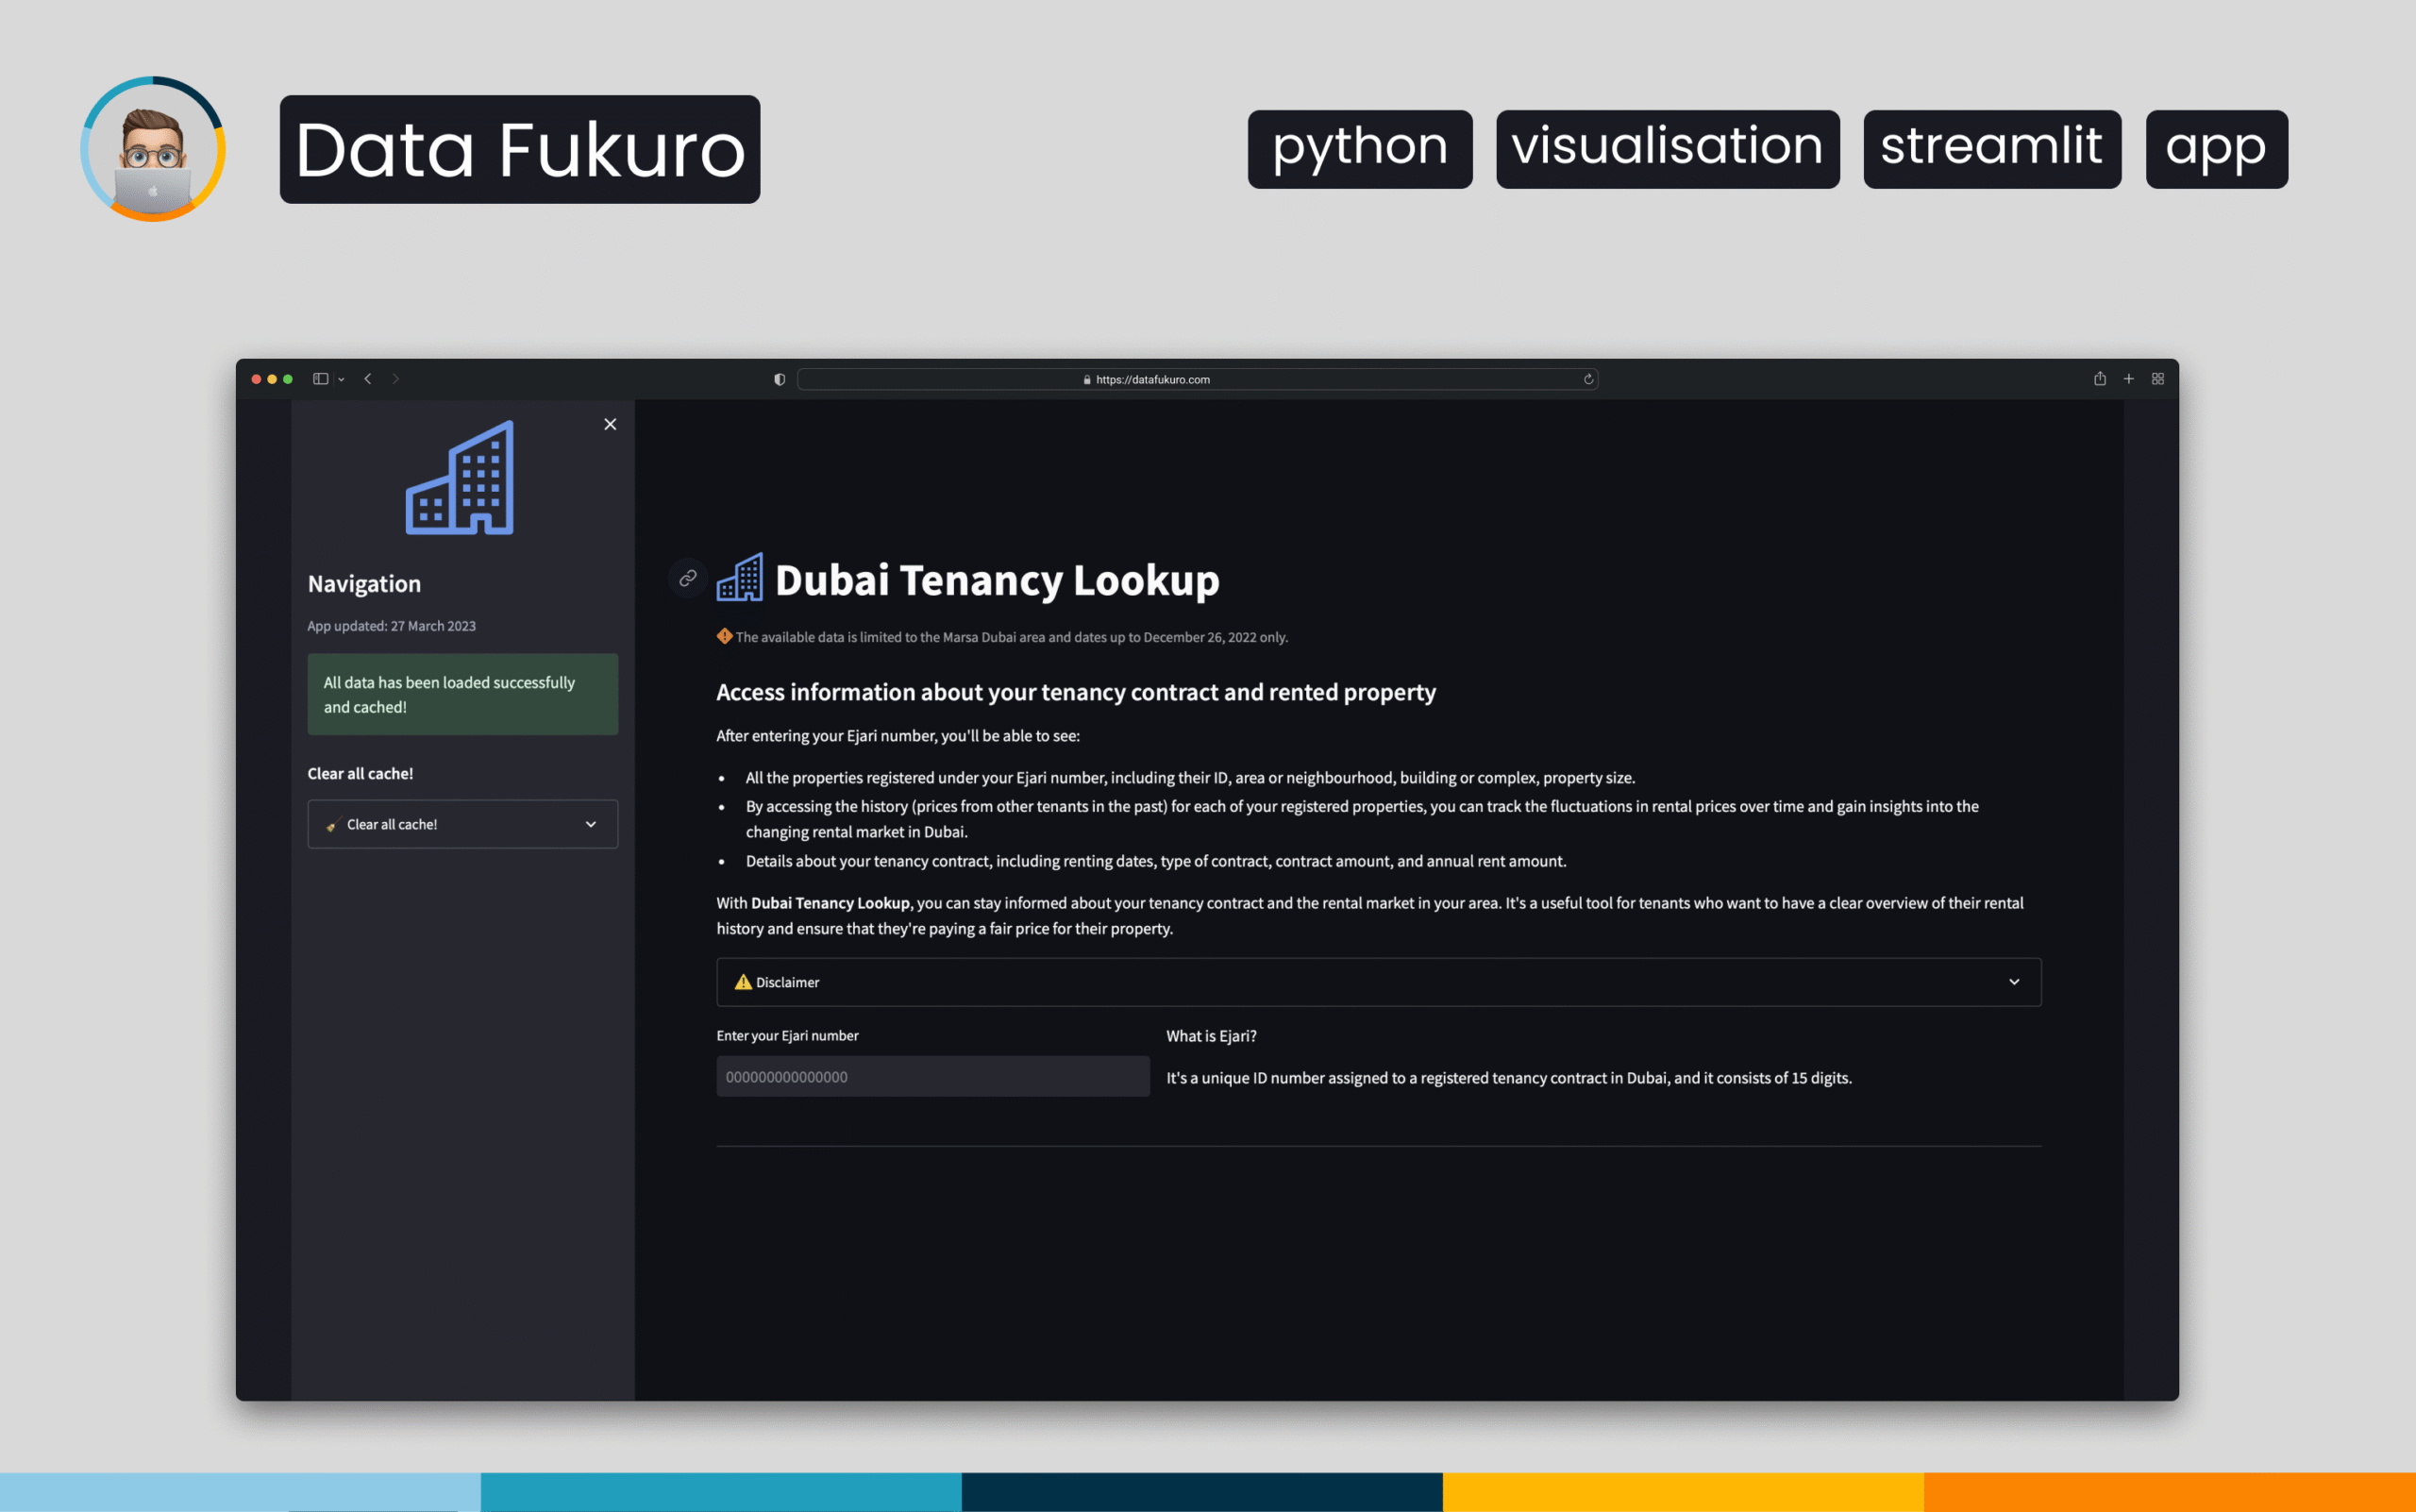
-
Real-Estate Visualization: Apartment Distribution in 29 BLVD Towers
This Tableau dashboard visualizes the 29 BLVD residential complex in Downtown Dubai using a floor-by-floor building layout. Each unit is represented as a coloured square mapped to its exact position within the towers. Users can explore apartment types, specifications and project details interactively, along with a geospatial view of the building’s location.
Project tags: Dashboard Design, Data Visualization, Geospatial Mapping, Interactive Charts, Open Data, Real-Estate Analytics, TableauRead more: Real-Estate Visualization: Apartment Distribution in 29 BLVD Towers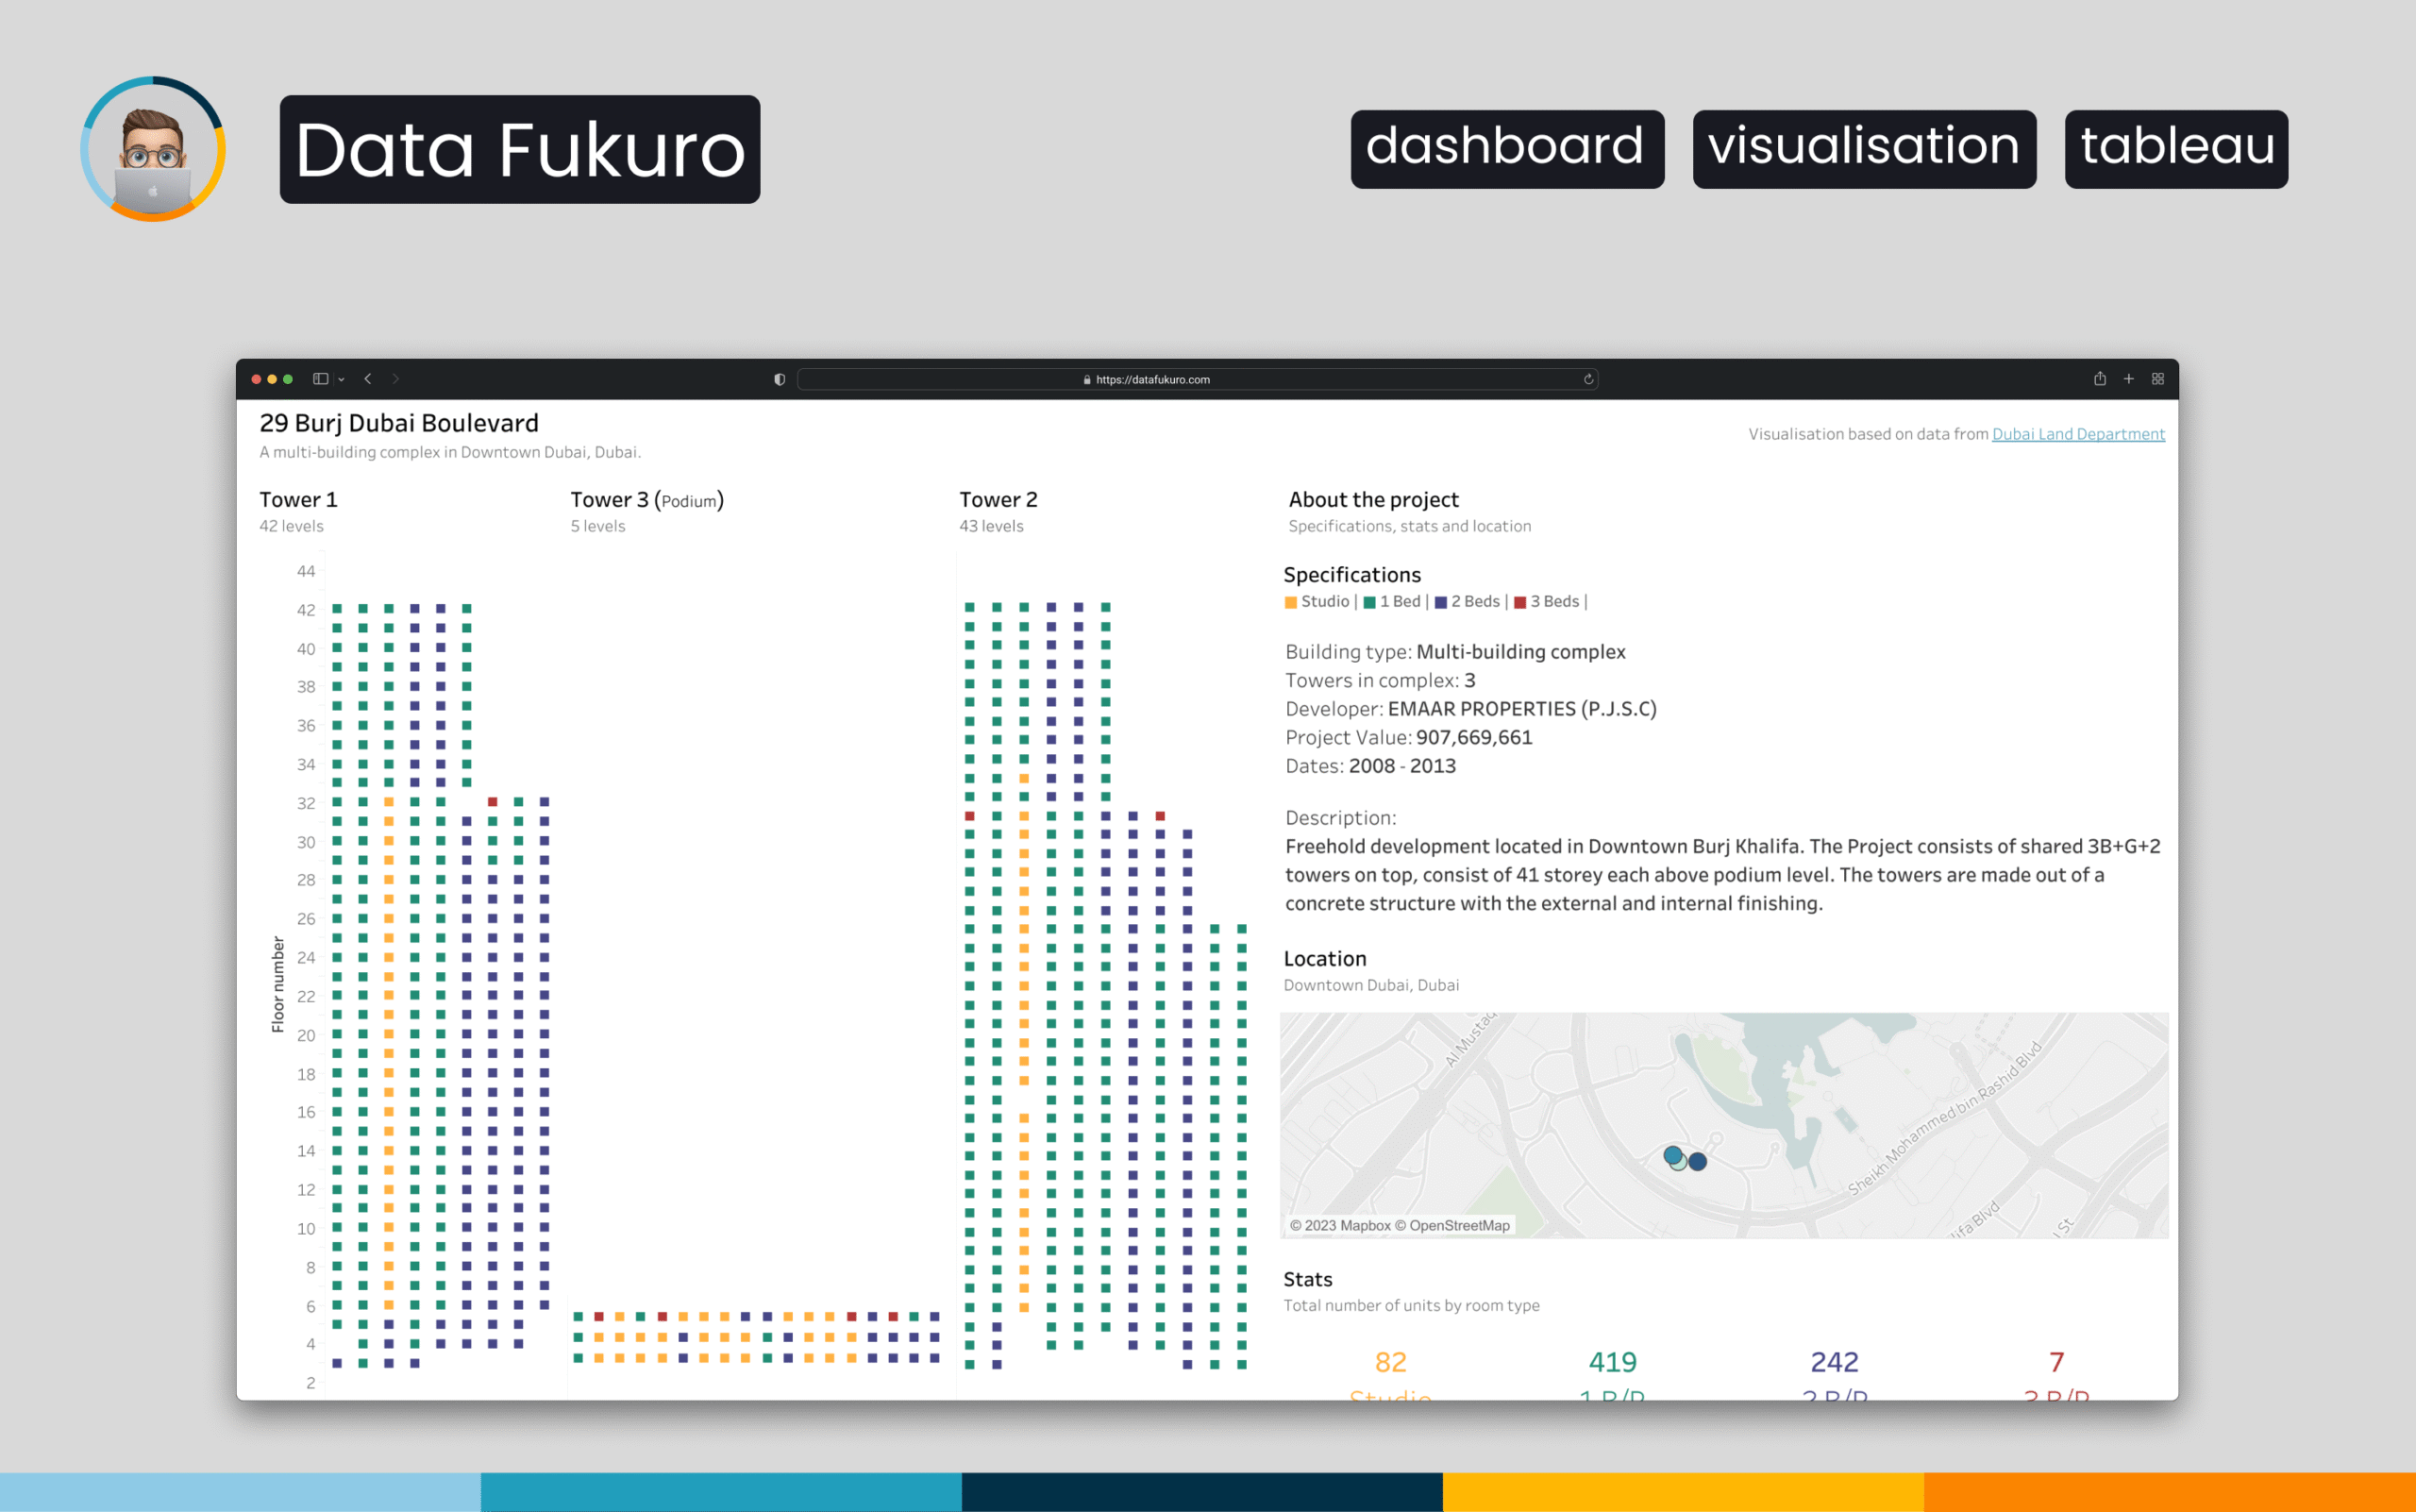
-
Visualizing Demographic Change in the United Arab Emirates
This Tableau dashboard visualizes the population dynamics of the United Arab Emirates from 1960 to 2021. Users can explore demographic trends by age group and gender through interactive filters and clear visual elements. The tool provides an accessible way to study long-term population shifts and compare different segments over time.
Project tags: Dashboard Design, Data Visualization, Demographic Analysis, Interactive Charts, Tableau, Time-Series ExplorationRead more: Visualizing Demographic Change in the United Arab Emirates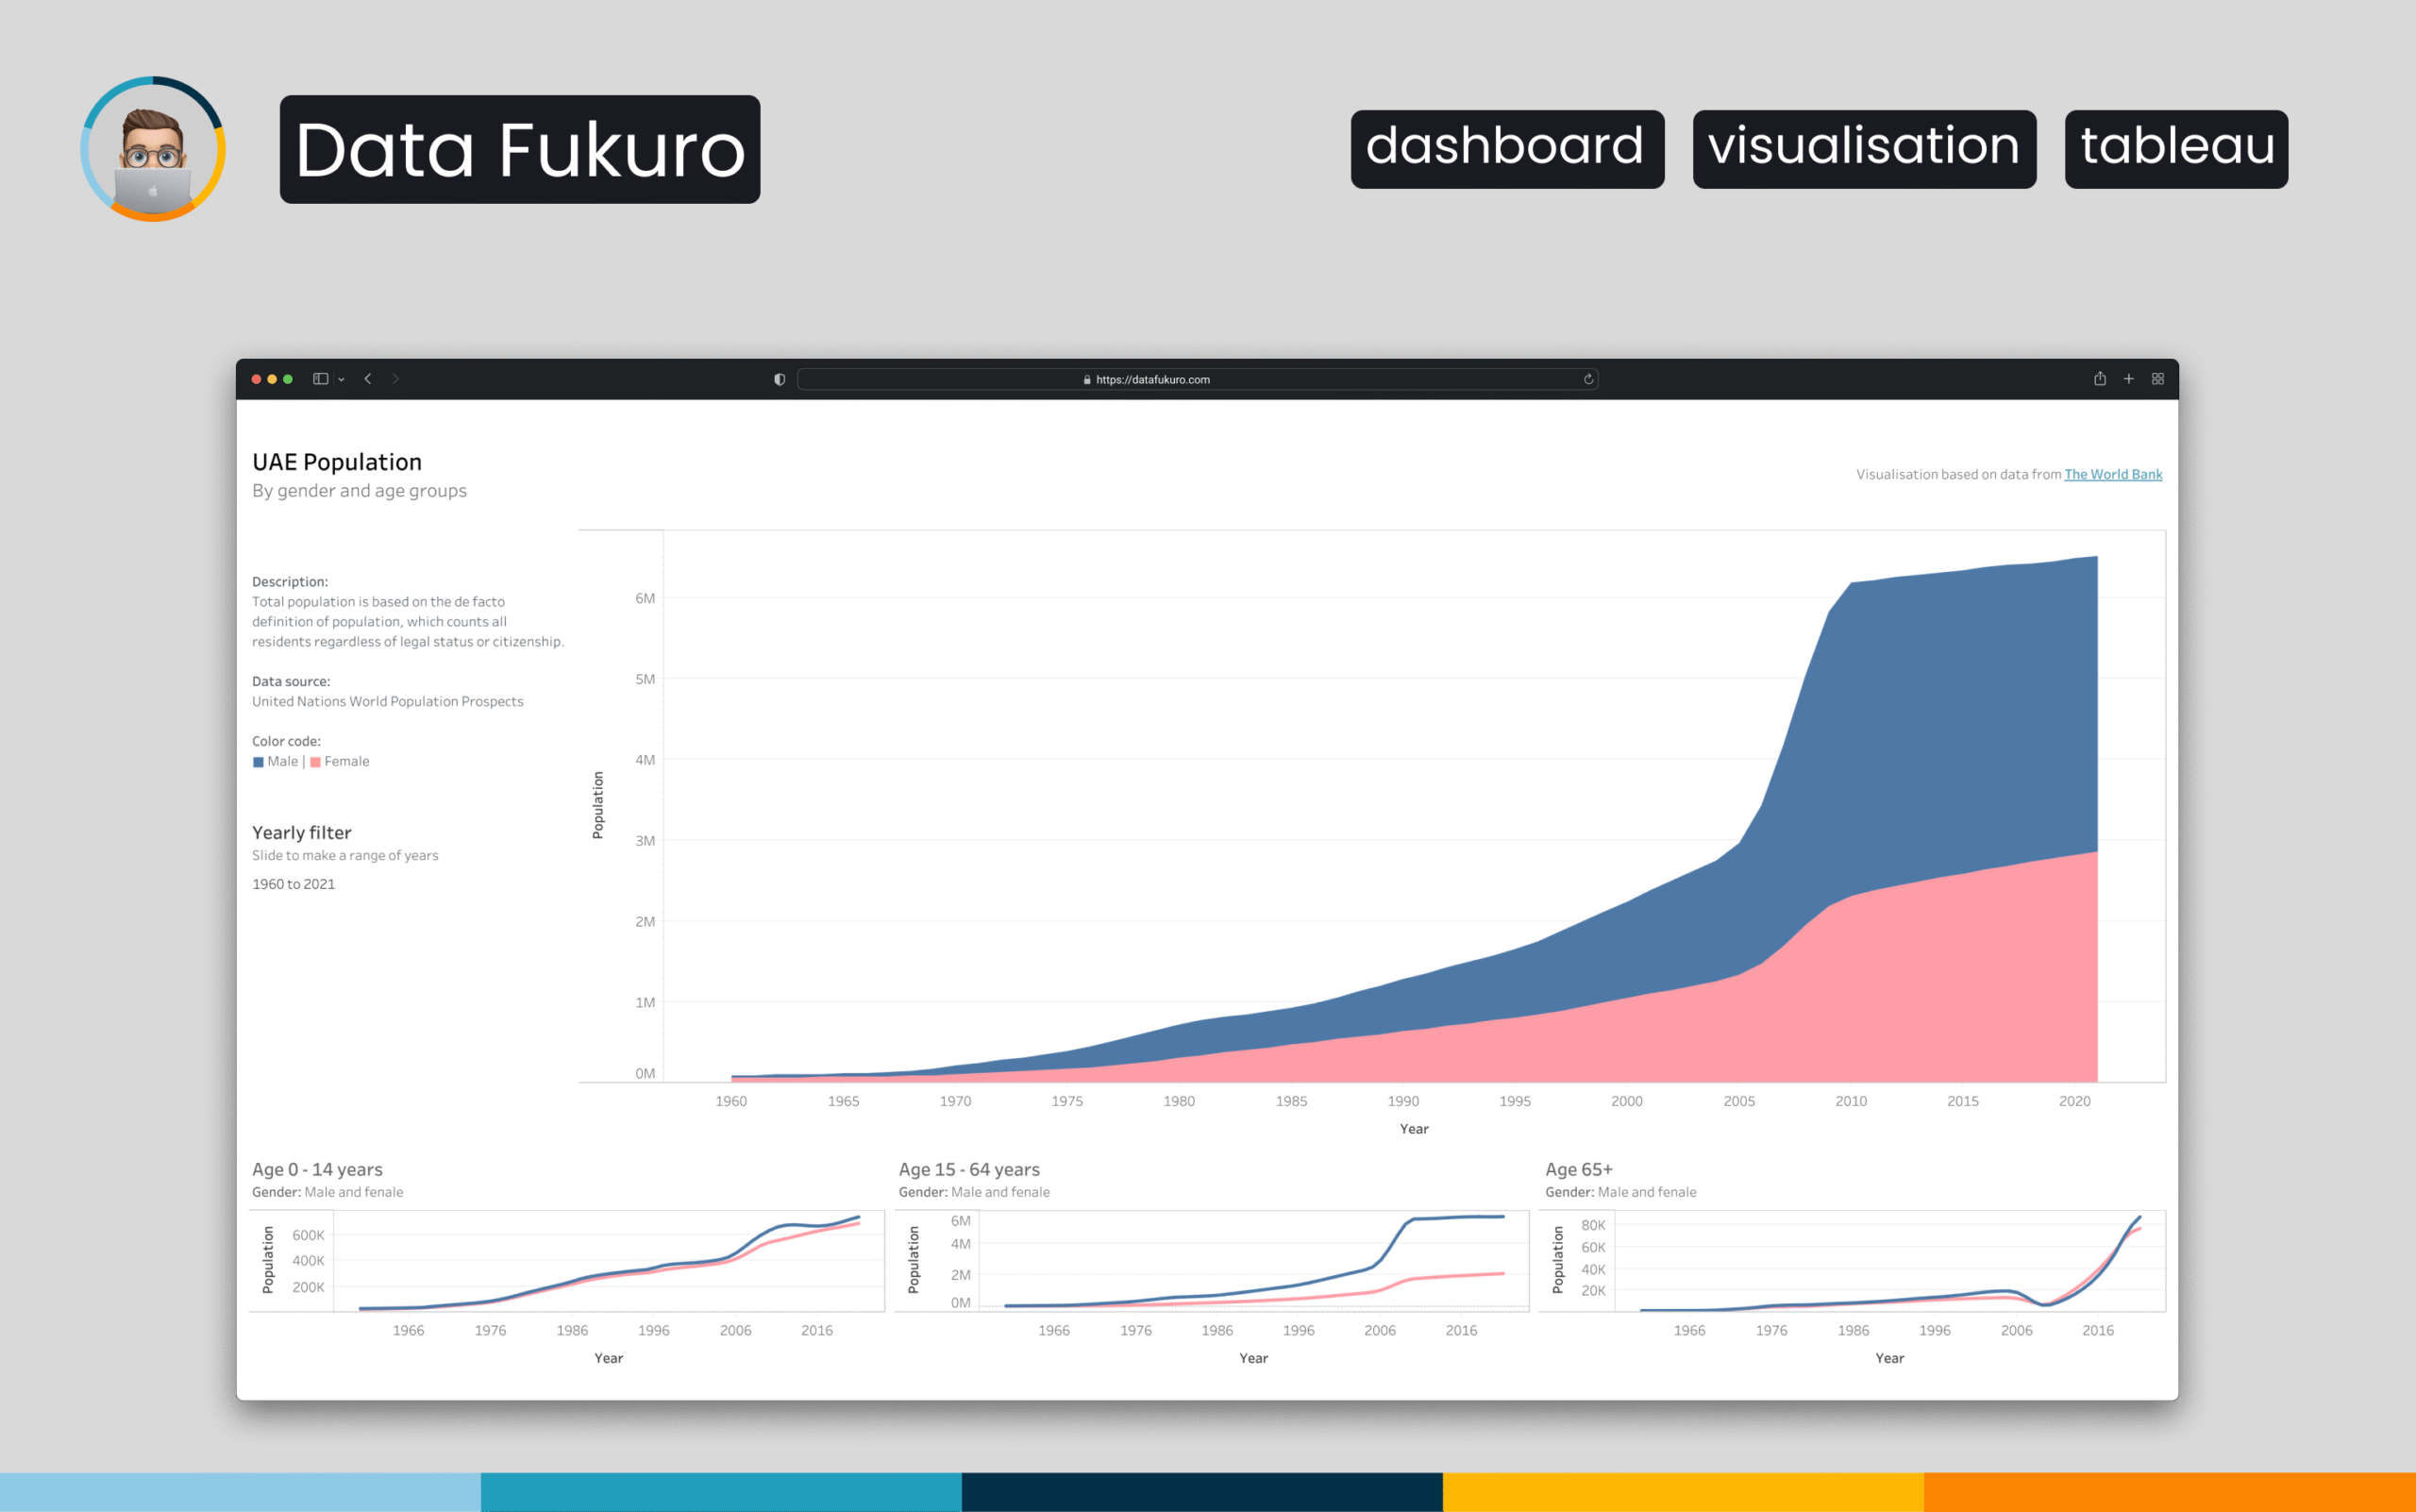
-
Dubai Rental Insights: Tableau Visualization
This Tableau dashboard visualizes rental market data from Dubai’s Downtown and DIFC districts. Users can explore prices by room type, compare median rents, view feature-driven price differences and analyze spatial patterns across major towers. The tool provides a clear, interactive overview of the rental landscape and supports smarter property research.
Project tags: Dashboard Design, Data Visualization, Exploratory Data Analysis, Geospatial Mapping, Interactive Charts, Real-Estate Analytics, TableauRead more: Dubai Rental Insights: Tableau Visualization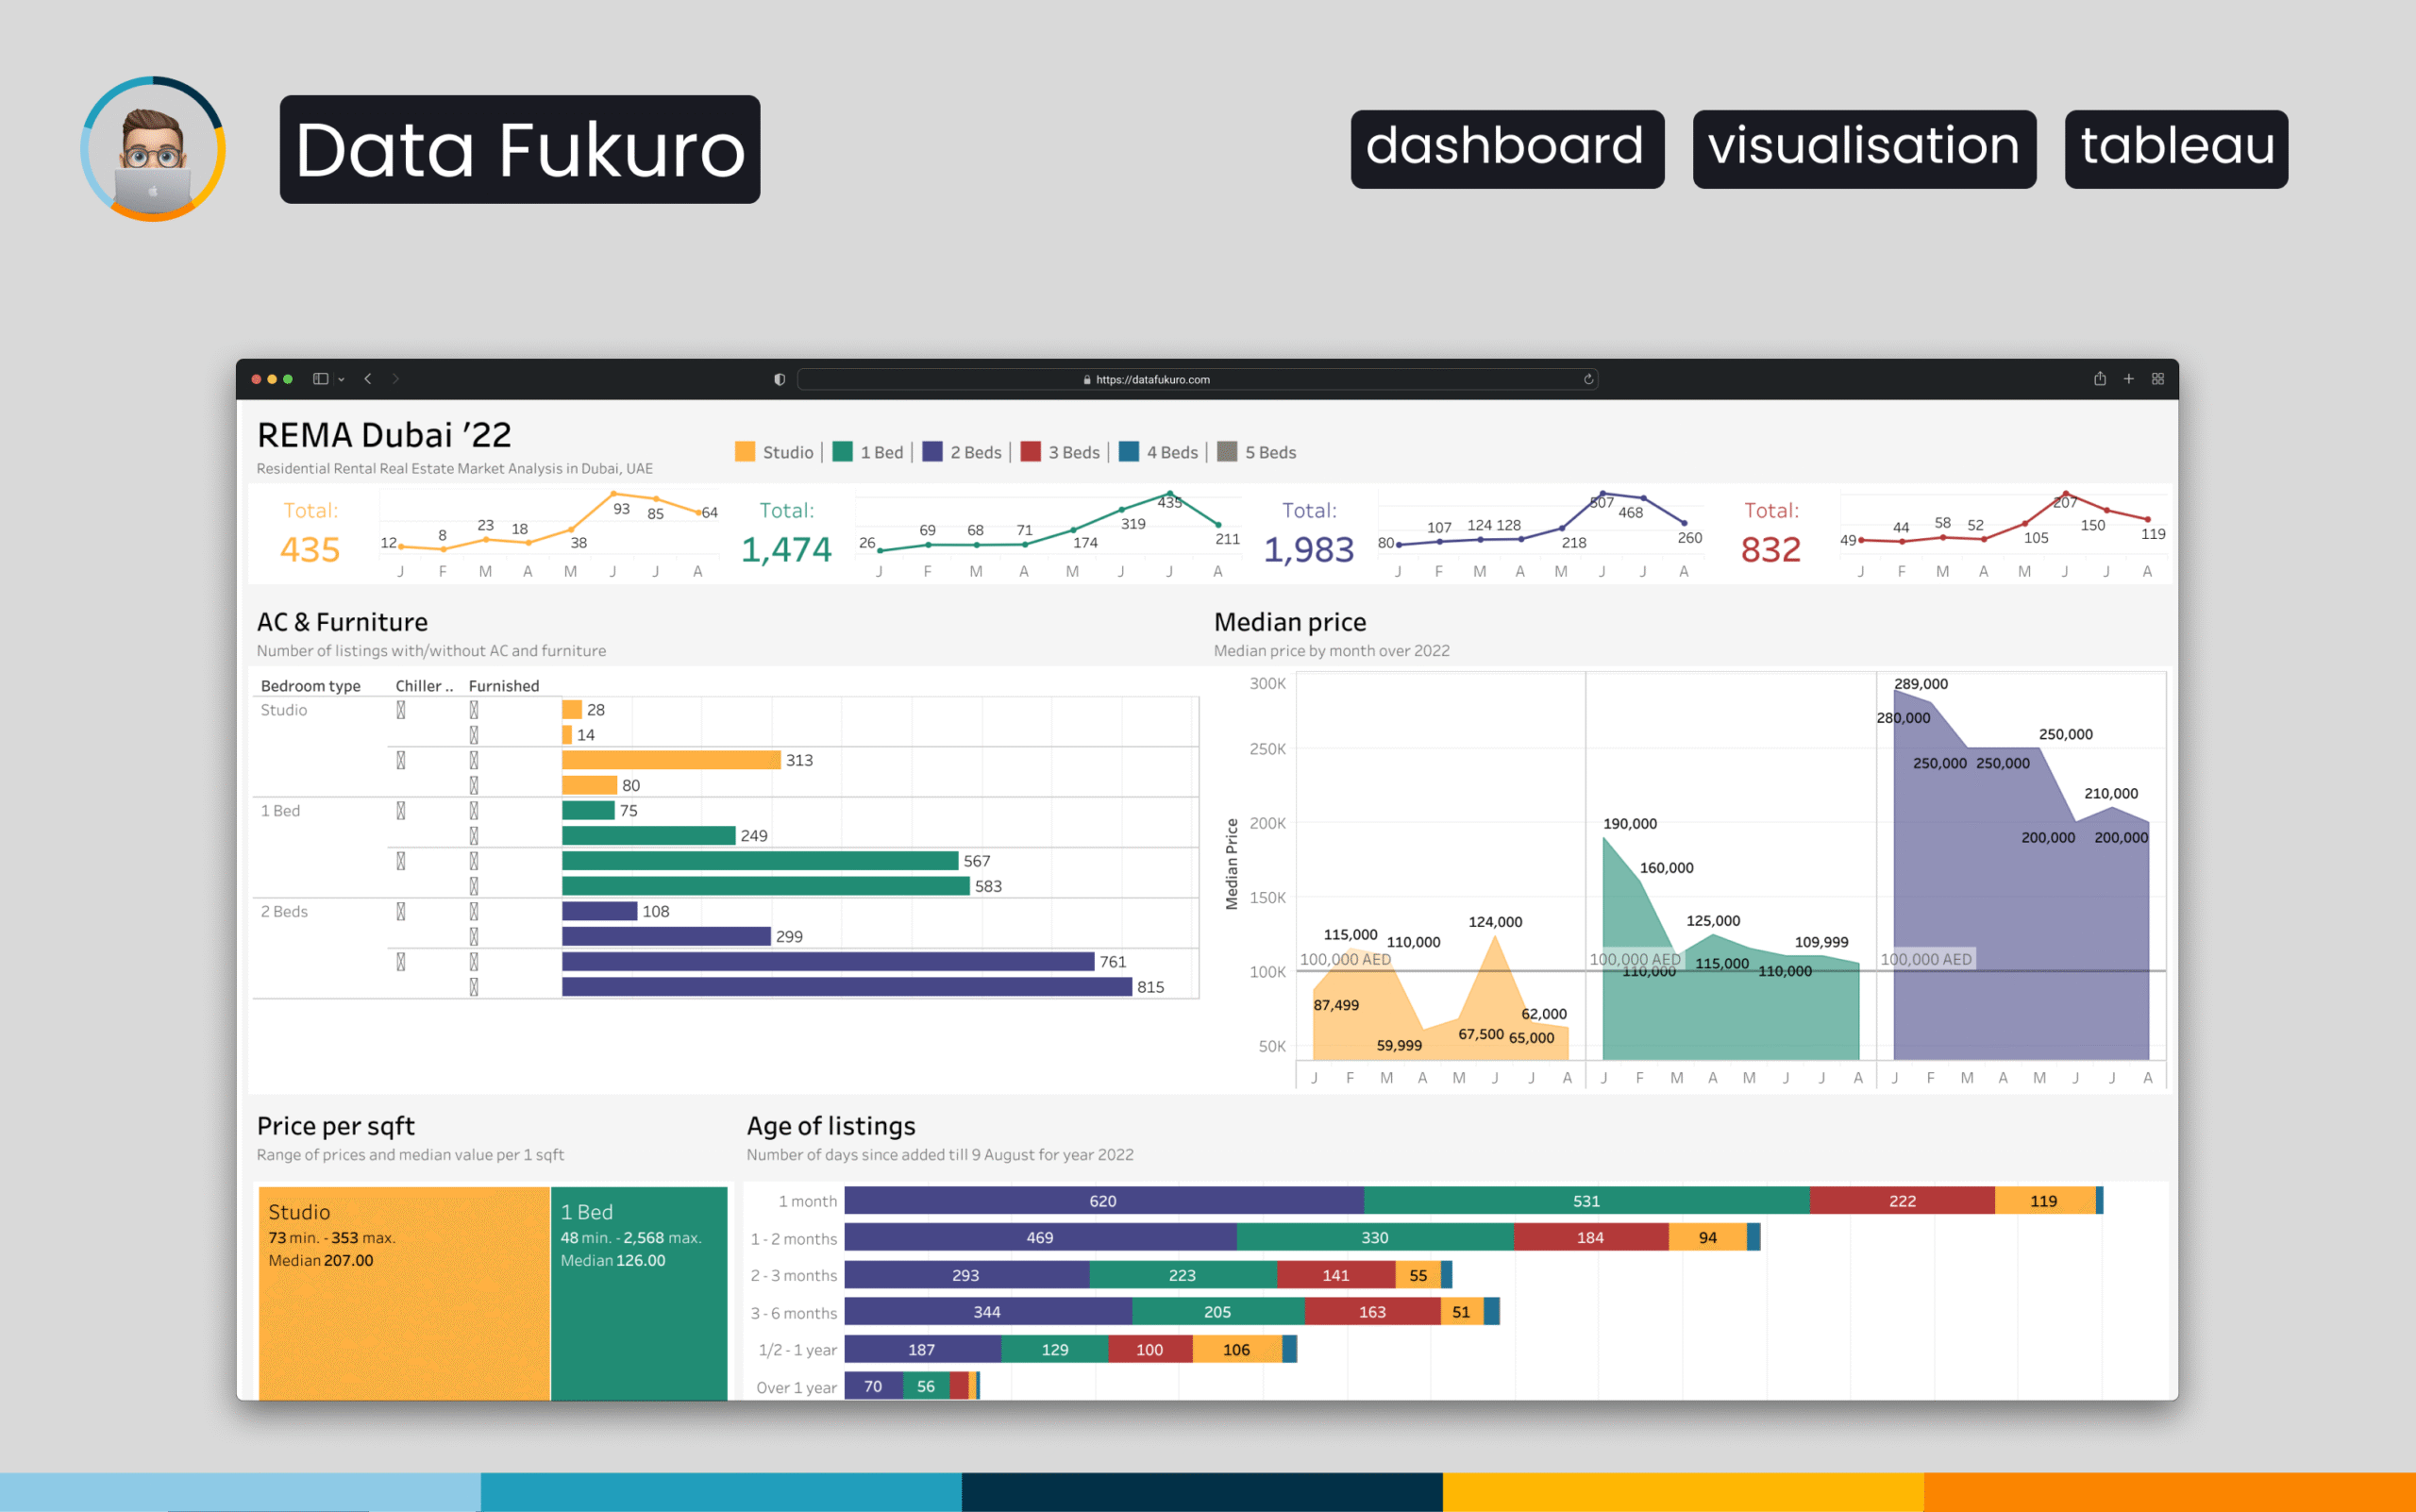
-
Real-Estate Market Insights for Dubai, DIFC & Downtown
This project analyses Bayut real-estate listings from Dubai, DIFC and Downtown to uncover pricing patterns, property characteristics and neighbourhood differences. After cleaning and structuring aggregated data, price per m² and key amenities were compared across districts. The analysis highlights market trends and provides insights useful for both buyers and investors.
Project tags: Data Cleaning, Data Visualization, Exploratory Data Analysis, Feature Engineering, Matplotlib, NumPy, Outlier Detection, Pandas, Seaborn, Web ScrapingRead more: Real-Estate Market Insights for Dubai, DIFC & Downtown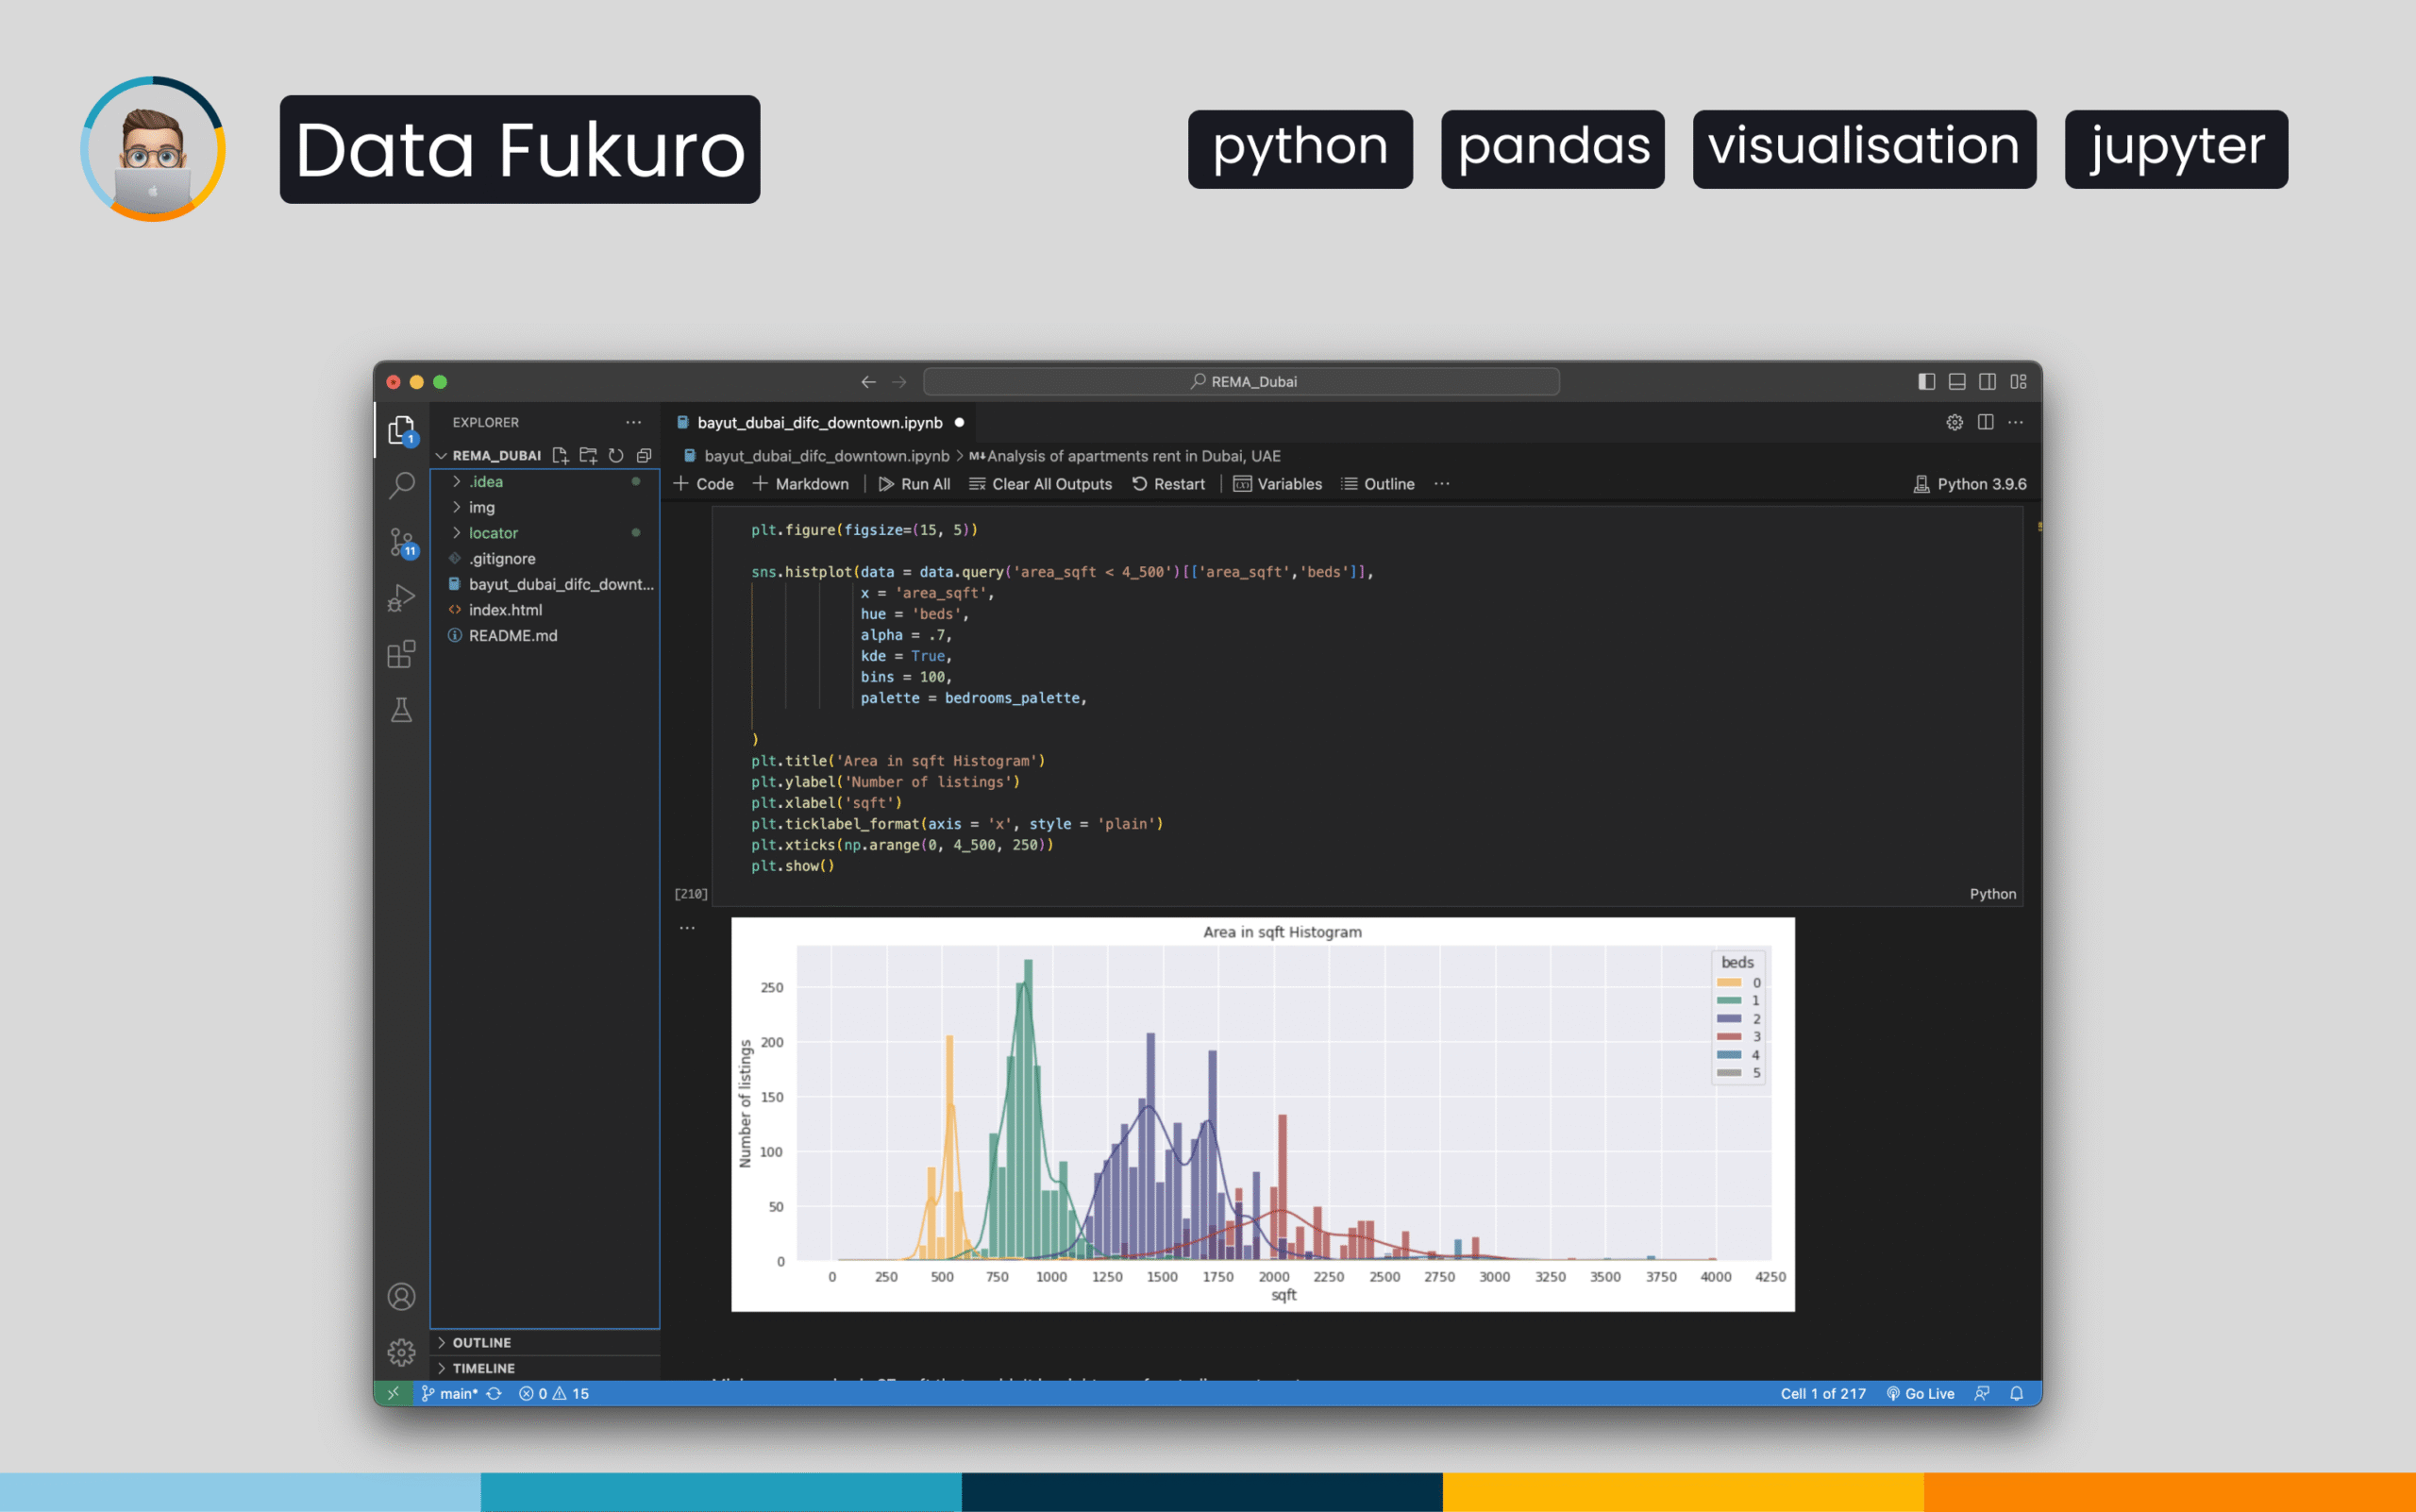
-
Industrial Cost Optimization with Regression Models
This project builds a regression model that predicts the cost of producing industrial equipment. After cleaning the data and engineering meaningful features, several algorithms were evaluated. The final model helps the company estimate production expenses more accurately and plan budgets with greater confidence.
Project tags: CatBoost, Cross-Validation, Data Cleaning, Feature Engineering, Gradient Boosting, Handling Missing Data, LightGBM, Machine Learning, Matplotlib, Model Evaluation, NumPy, Pandas, Regression Modeling, Scikit-learnRead more: Industrial Cost Optimization with Regression Models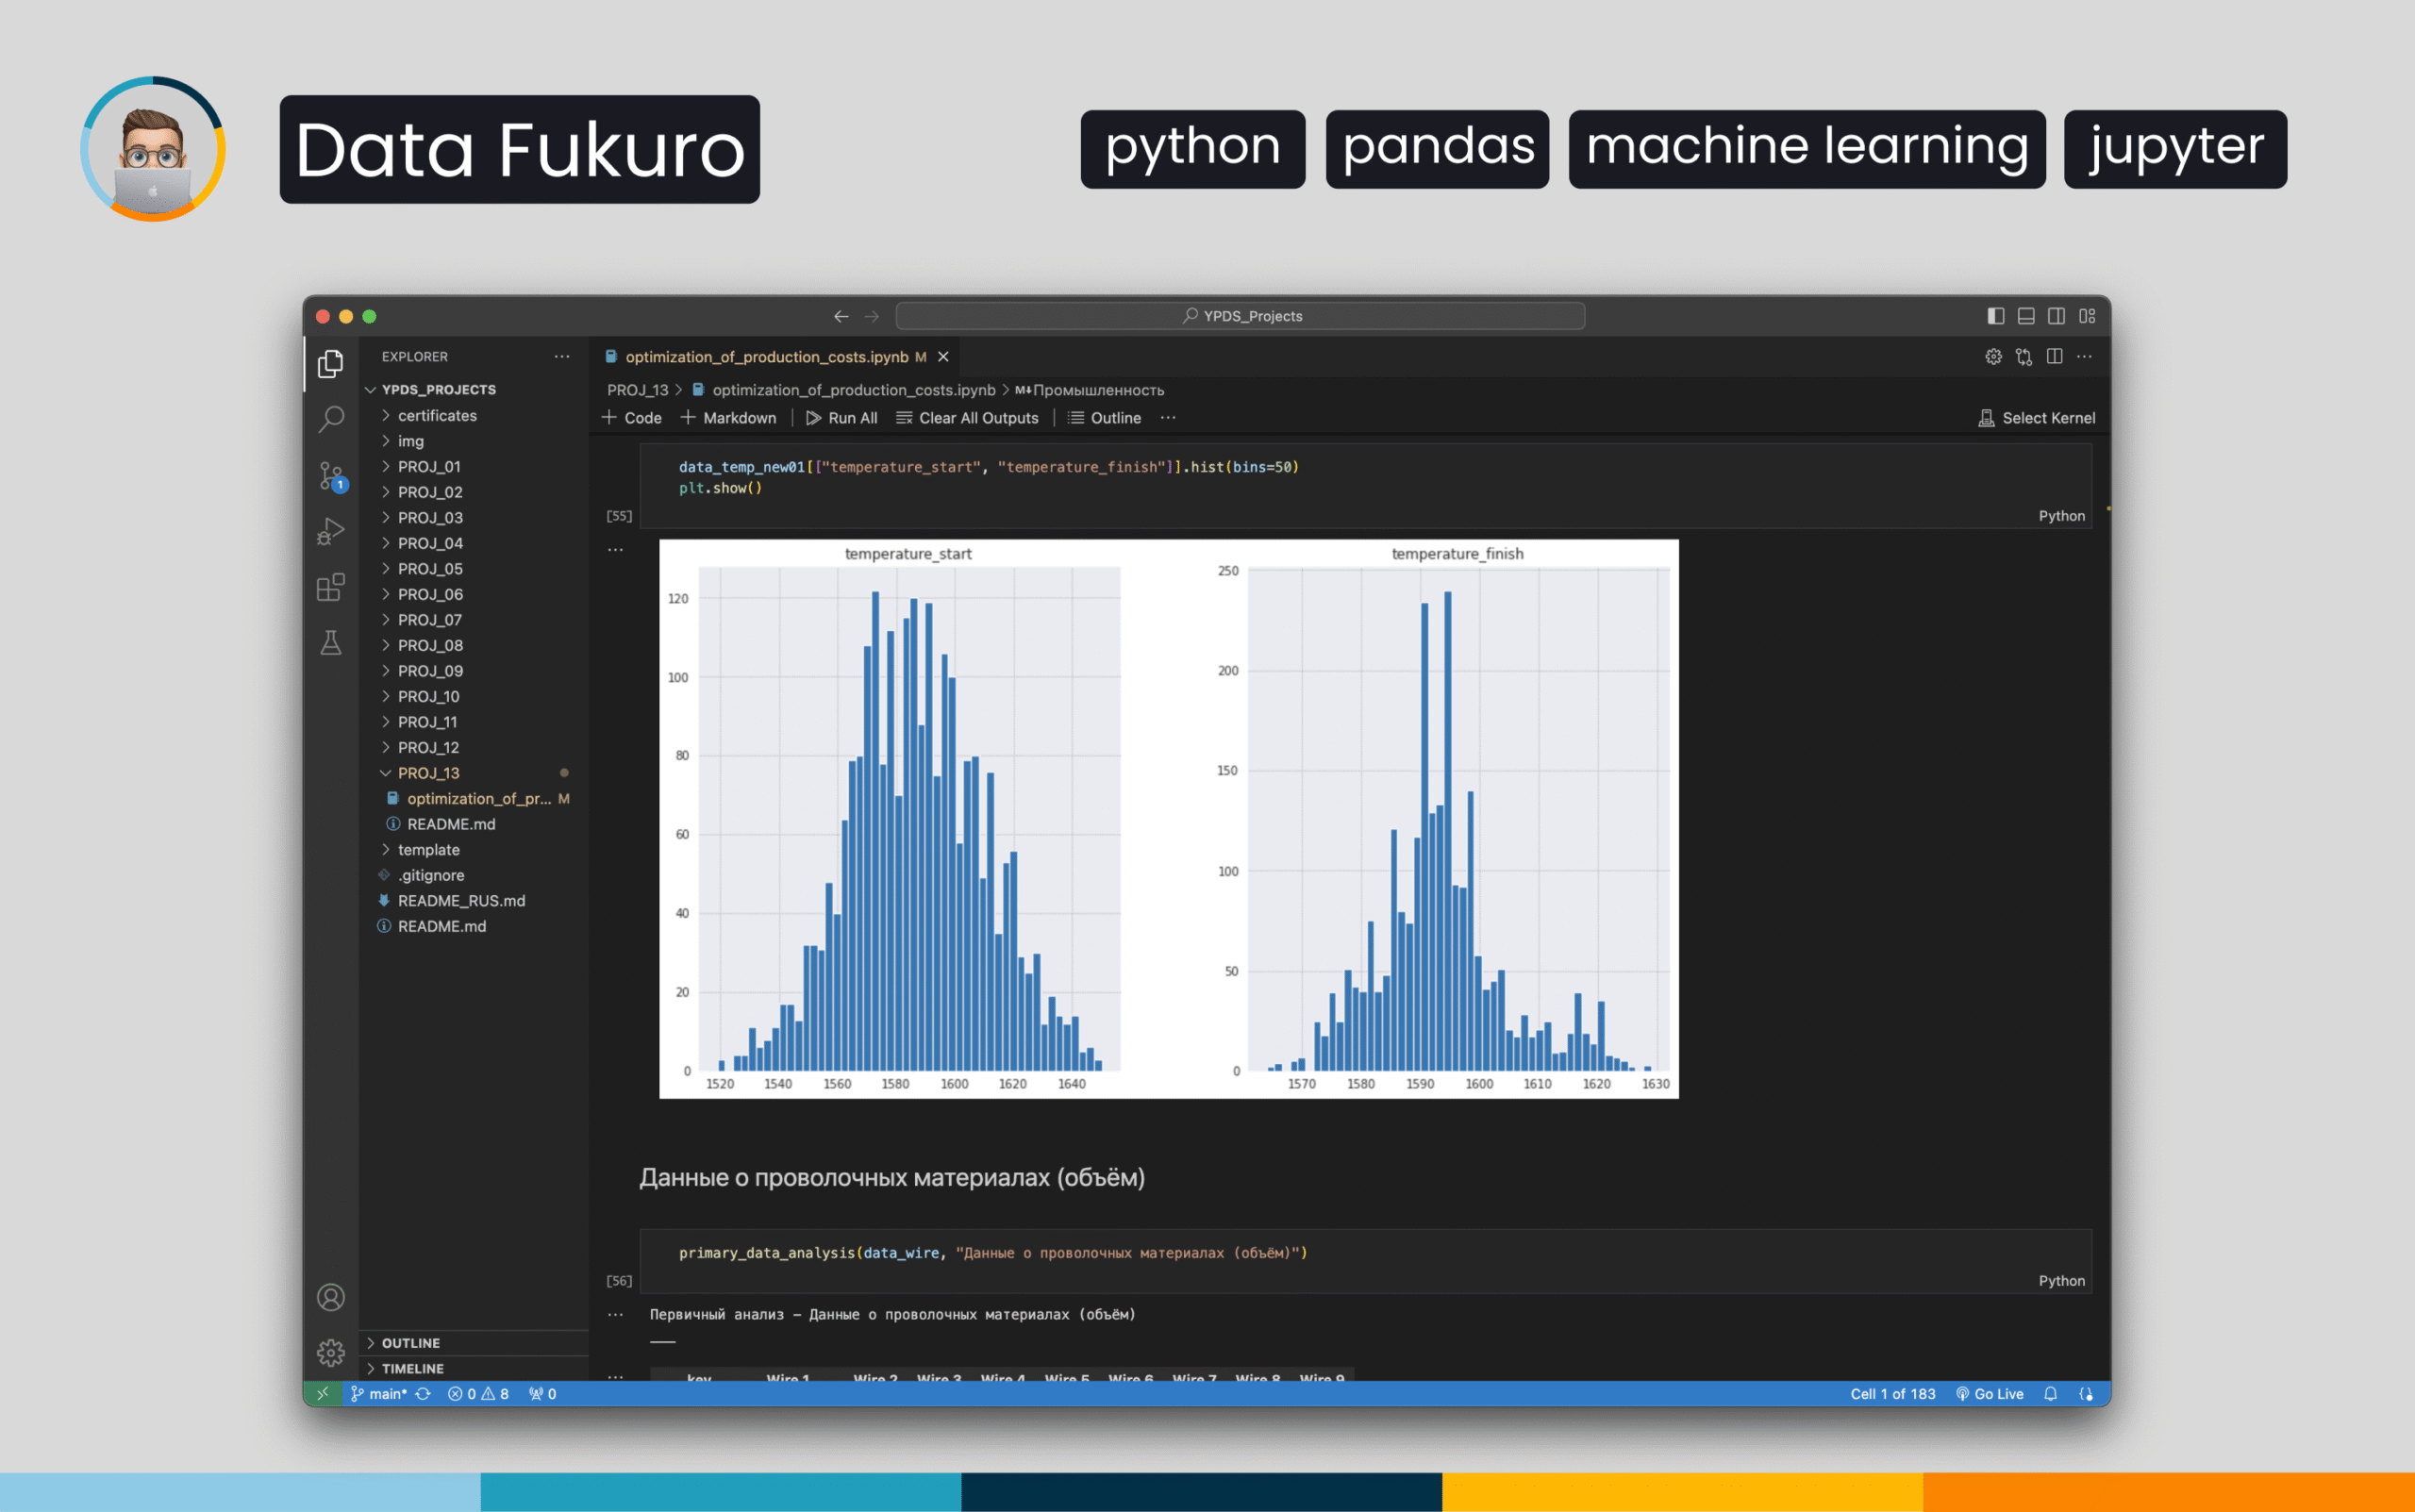
-
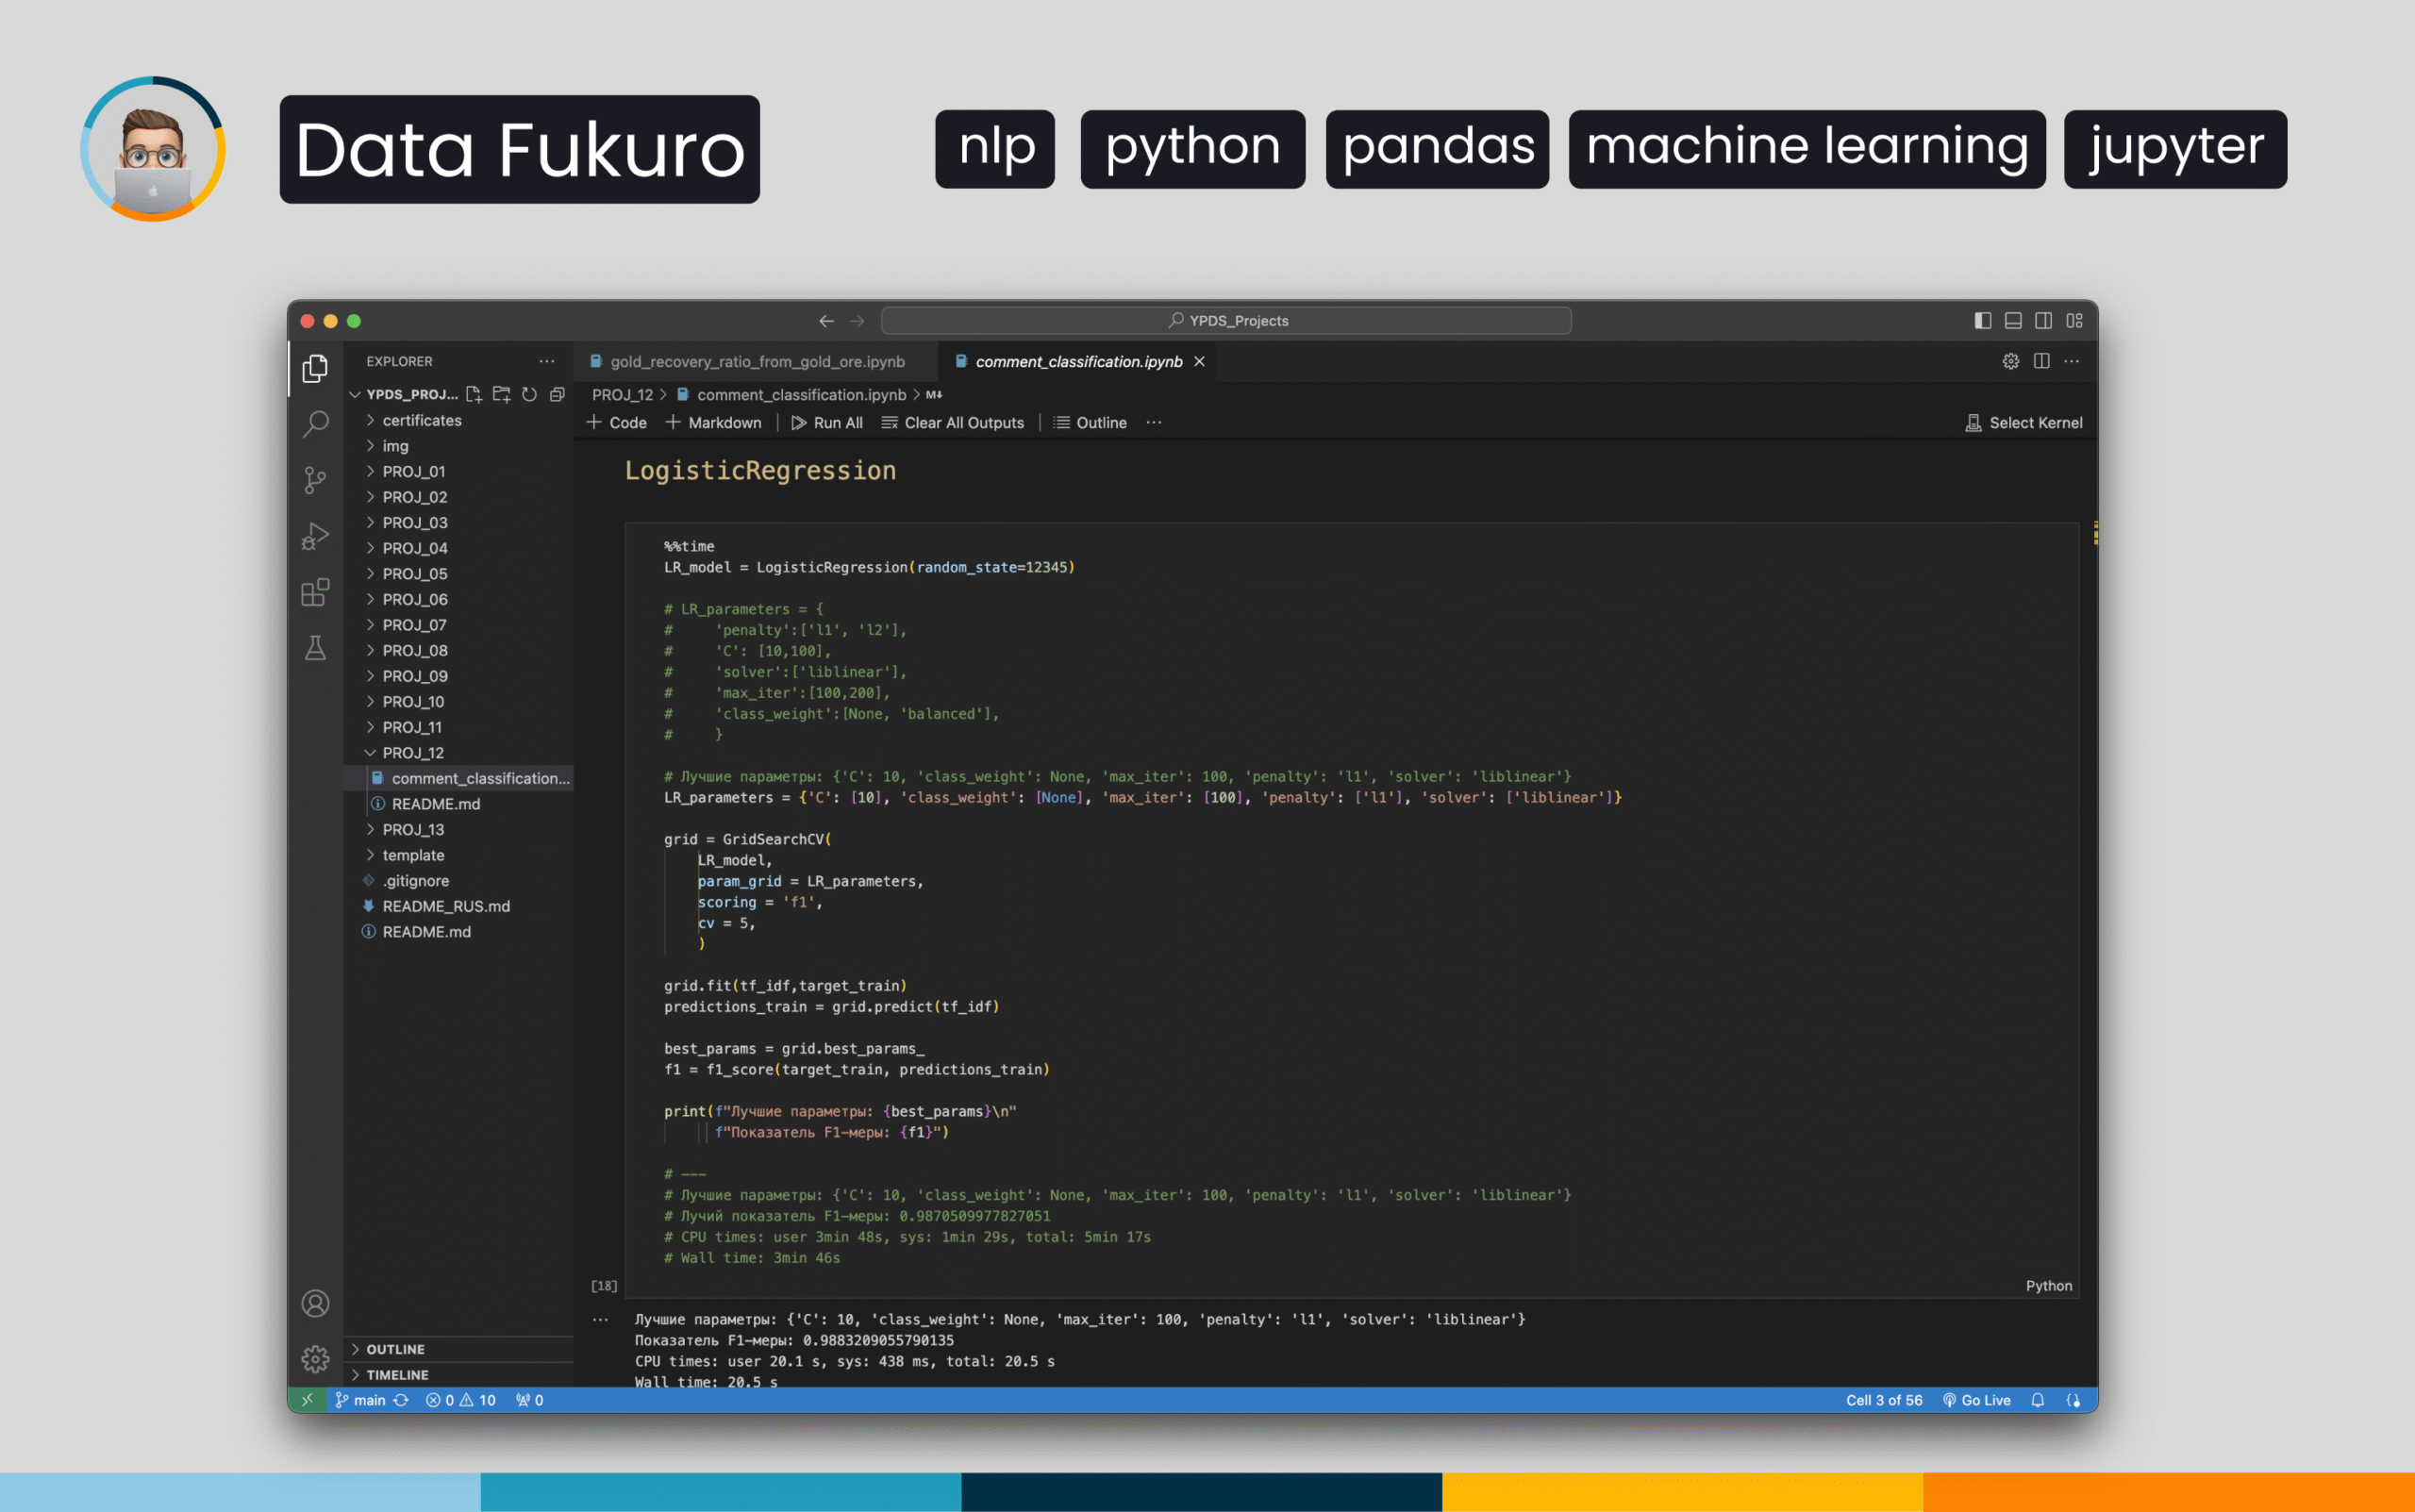
Comment Moderation: Text Classification Model
This project builds a machine-learning model that classifies user comments as toxic or non-toxic. After cleaning the text and converting it into numerical features with TF-IDF, several algorithms were tested and tuned. The final model helps online platforms flag harmful content automatically and maintain a safer communication environment.
Project tags: Classification Modeling, Feature Engineering, Grid Search, Machine Learning, Model Evaluation, Natural Language Processing, NumPy, Pandas, Scikit-learn, Text Preprocessing, TF-IDF VectorizationRead more: Comment Moderation: Text Classification Model