Project details:
This Tableau dashboard visualizes the population dynamics of the United Arab Emirates from 1960 to 2021. Users can explore demographic trends by age group and gender through interactive filters and clear visual elements. The tool provides an accessible way to study long-term population shifts and compare different segments over time.
Description
Business Context & Problem
Understanding demographic change is essential for planning in sectors such as healthcare, education, housing and workforce development. Public data is available, but not always presented in a way that allows easy exploration. This project builds an interactive Tableau dashboard that helps users analyse how the UAE population evolved over six decades, segmented by age and gender.
Data & Analytical Approach
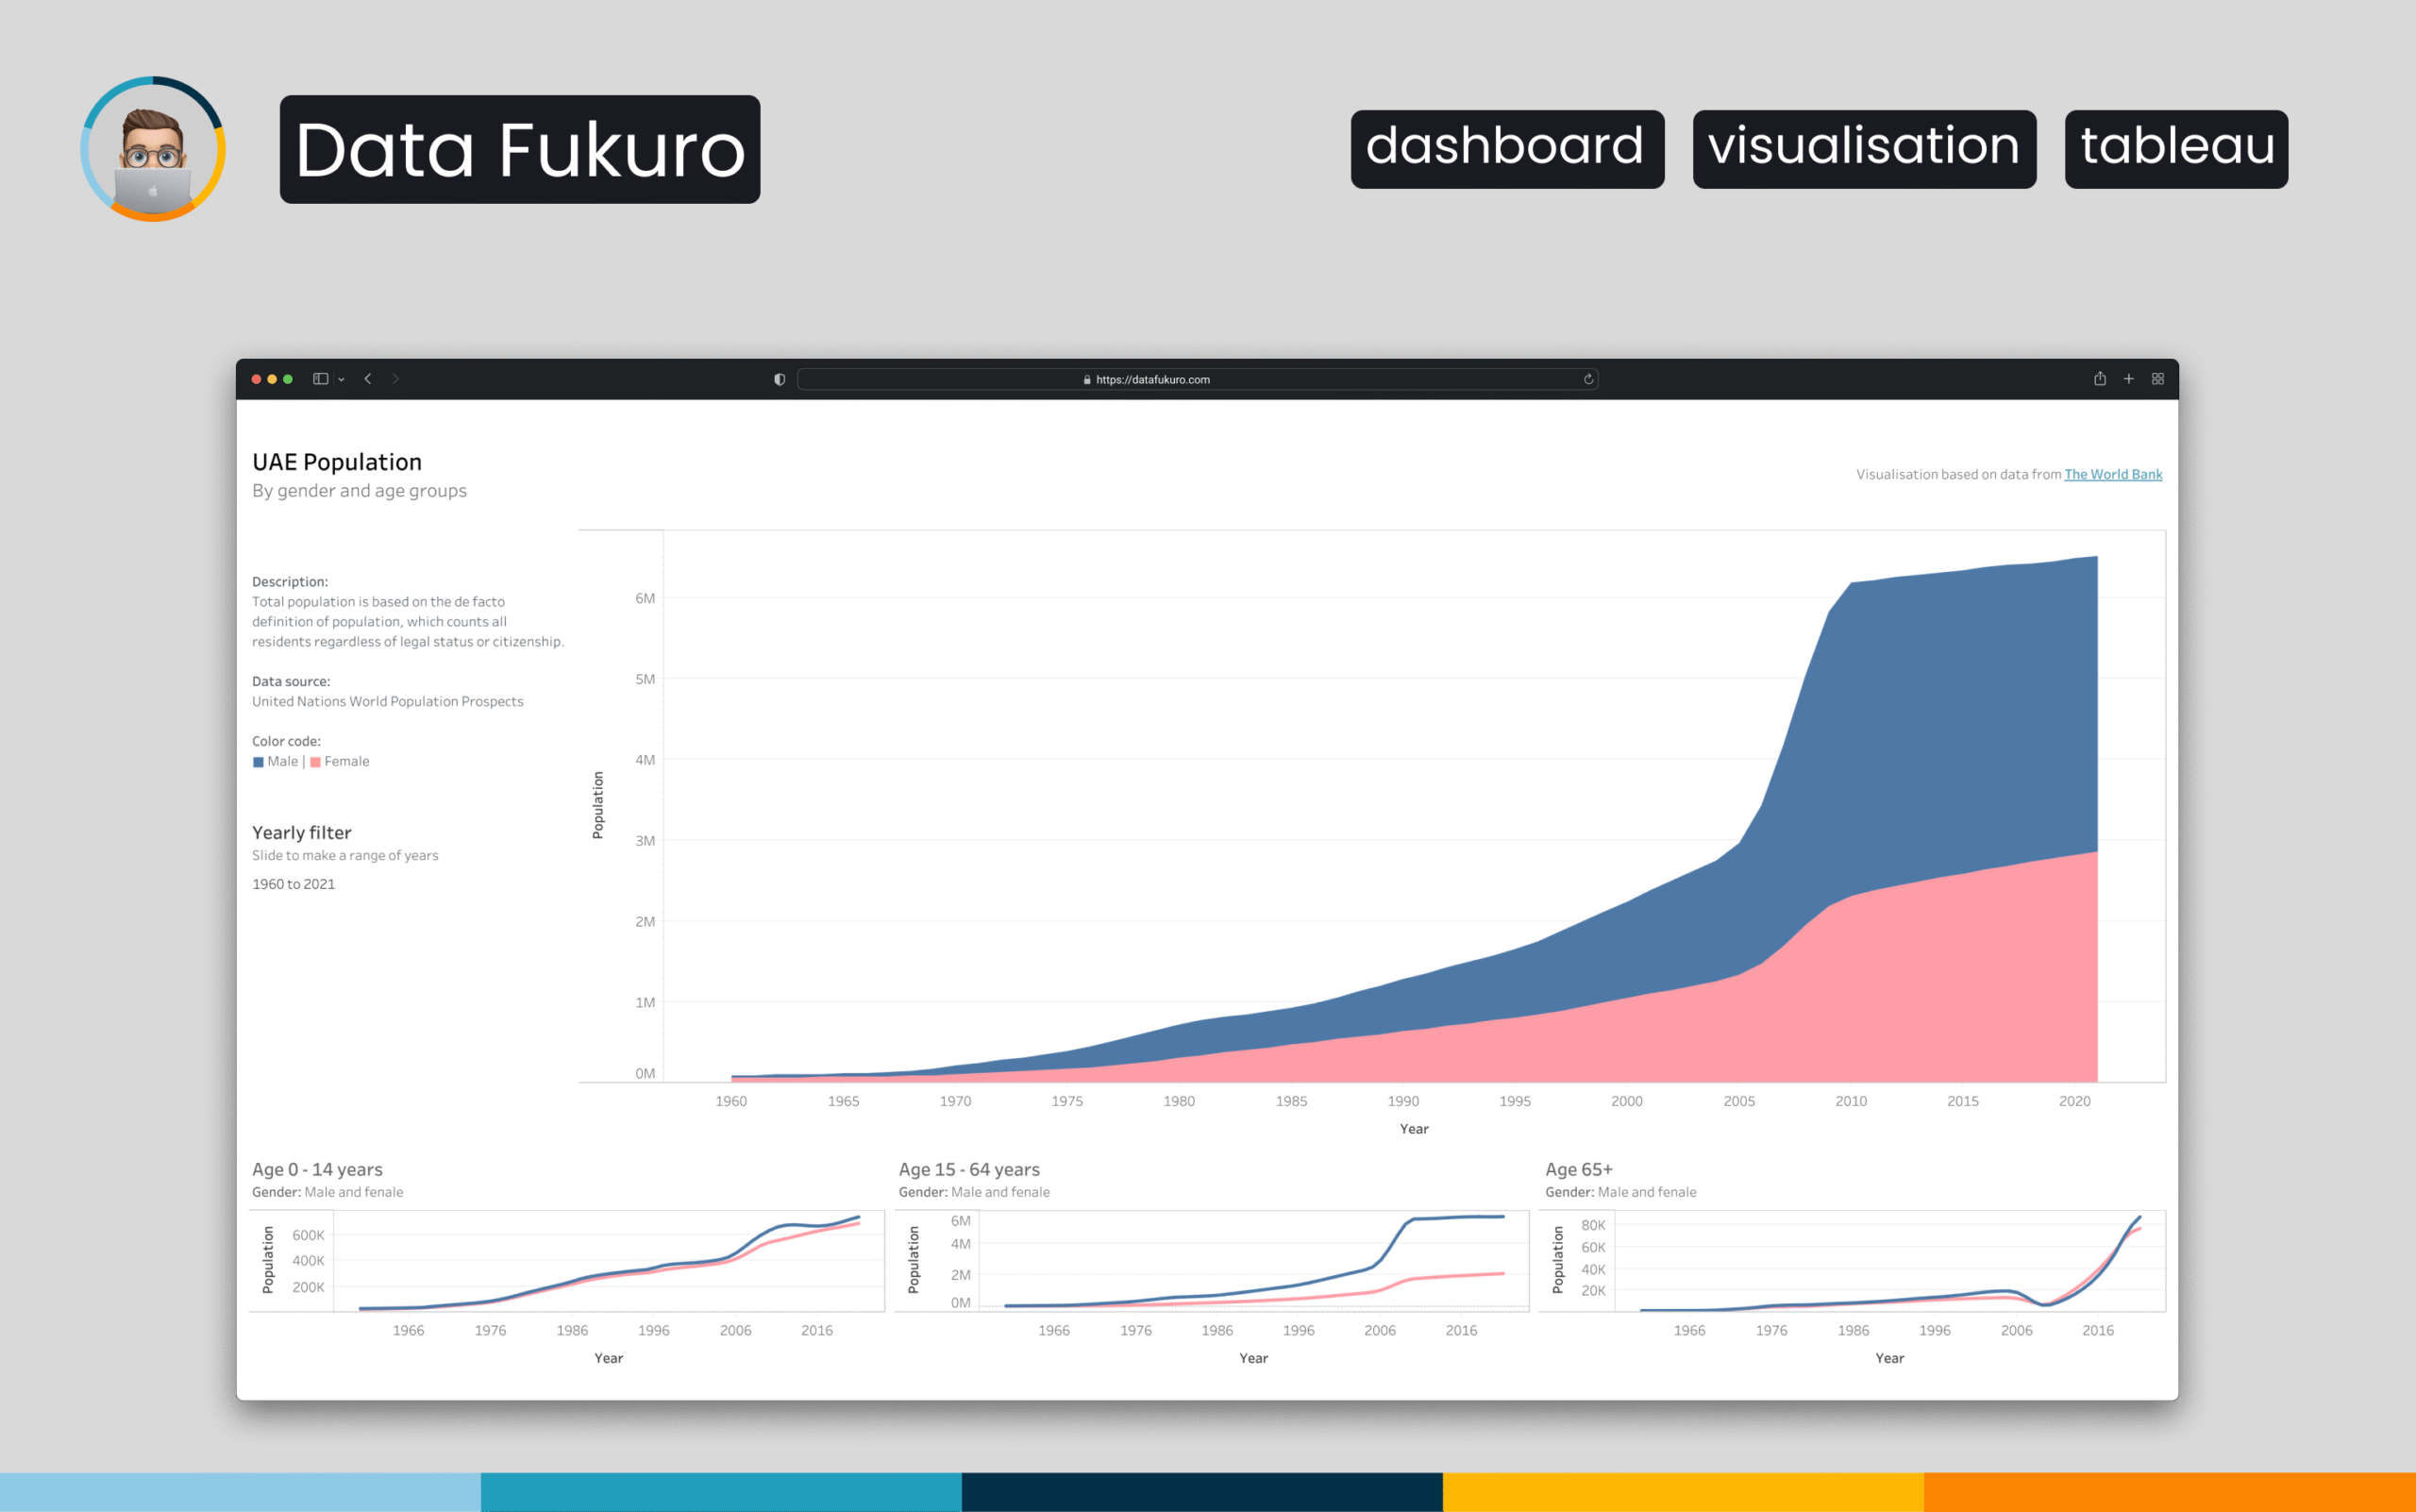
The dashboard uses population data from the United Nations World Population Prospects, structured as yearly totals across age brackets and gender. The data was cleaned and prepared for visualization, ensuring consistent labels and time-series structure.
Visual design focused on clarity: separate views for each age group, color-coding for gender and intuitive filters that let users narrow the time range or focus on specific segments.
Visualization & Interaction Design
The main chart presents the total population over time, allowing users to adjust the year range and instantly see changes in demographic growth. Additional line charts break the population into three groups — 0–14, 15–64 and 65+ — making it easy to compare how each segment has evolved.
Interactive filtering and synchronized axes help users explore trends smoothly without overwhelming detail.
Key Insights & Final Recommendations
The dashboard highlights significant population growth beginning in the early 2000s, driven mainly by working-age residents. Gender distribution shows consistent imbalances typical for the region’s labor market.
Such a tool can support policy discussions, quick exploratory research or presentations where clear demographic context is needed. The dashboard can be expanded further with projections, migration data or region-specific breakdowns.