Project details:
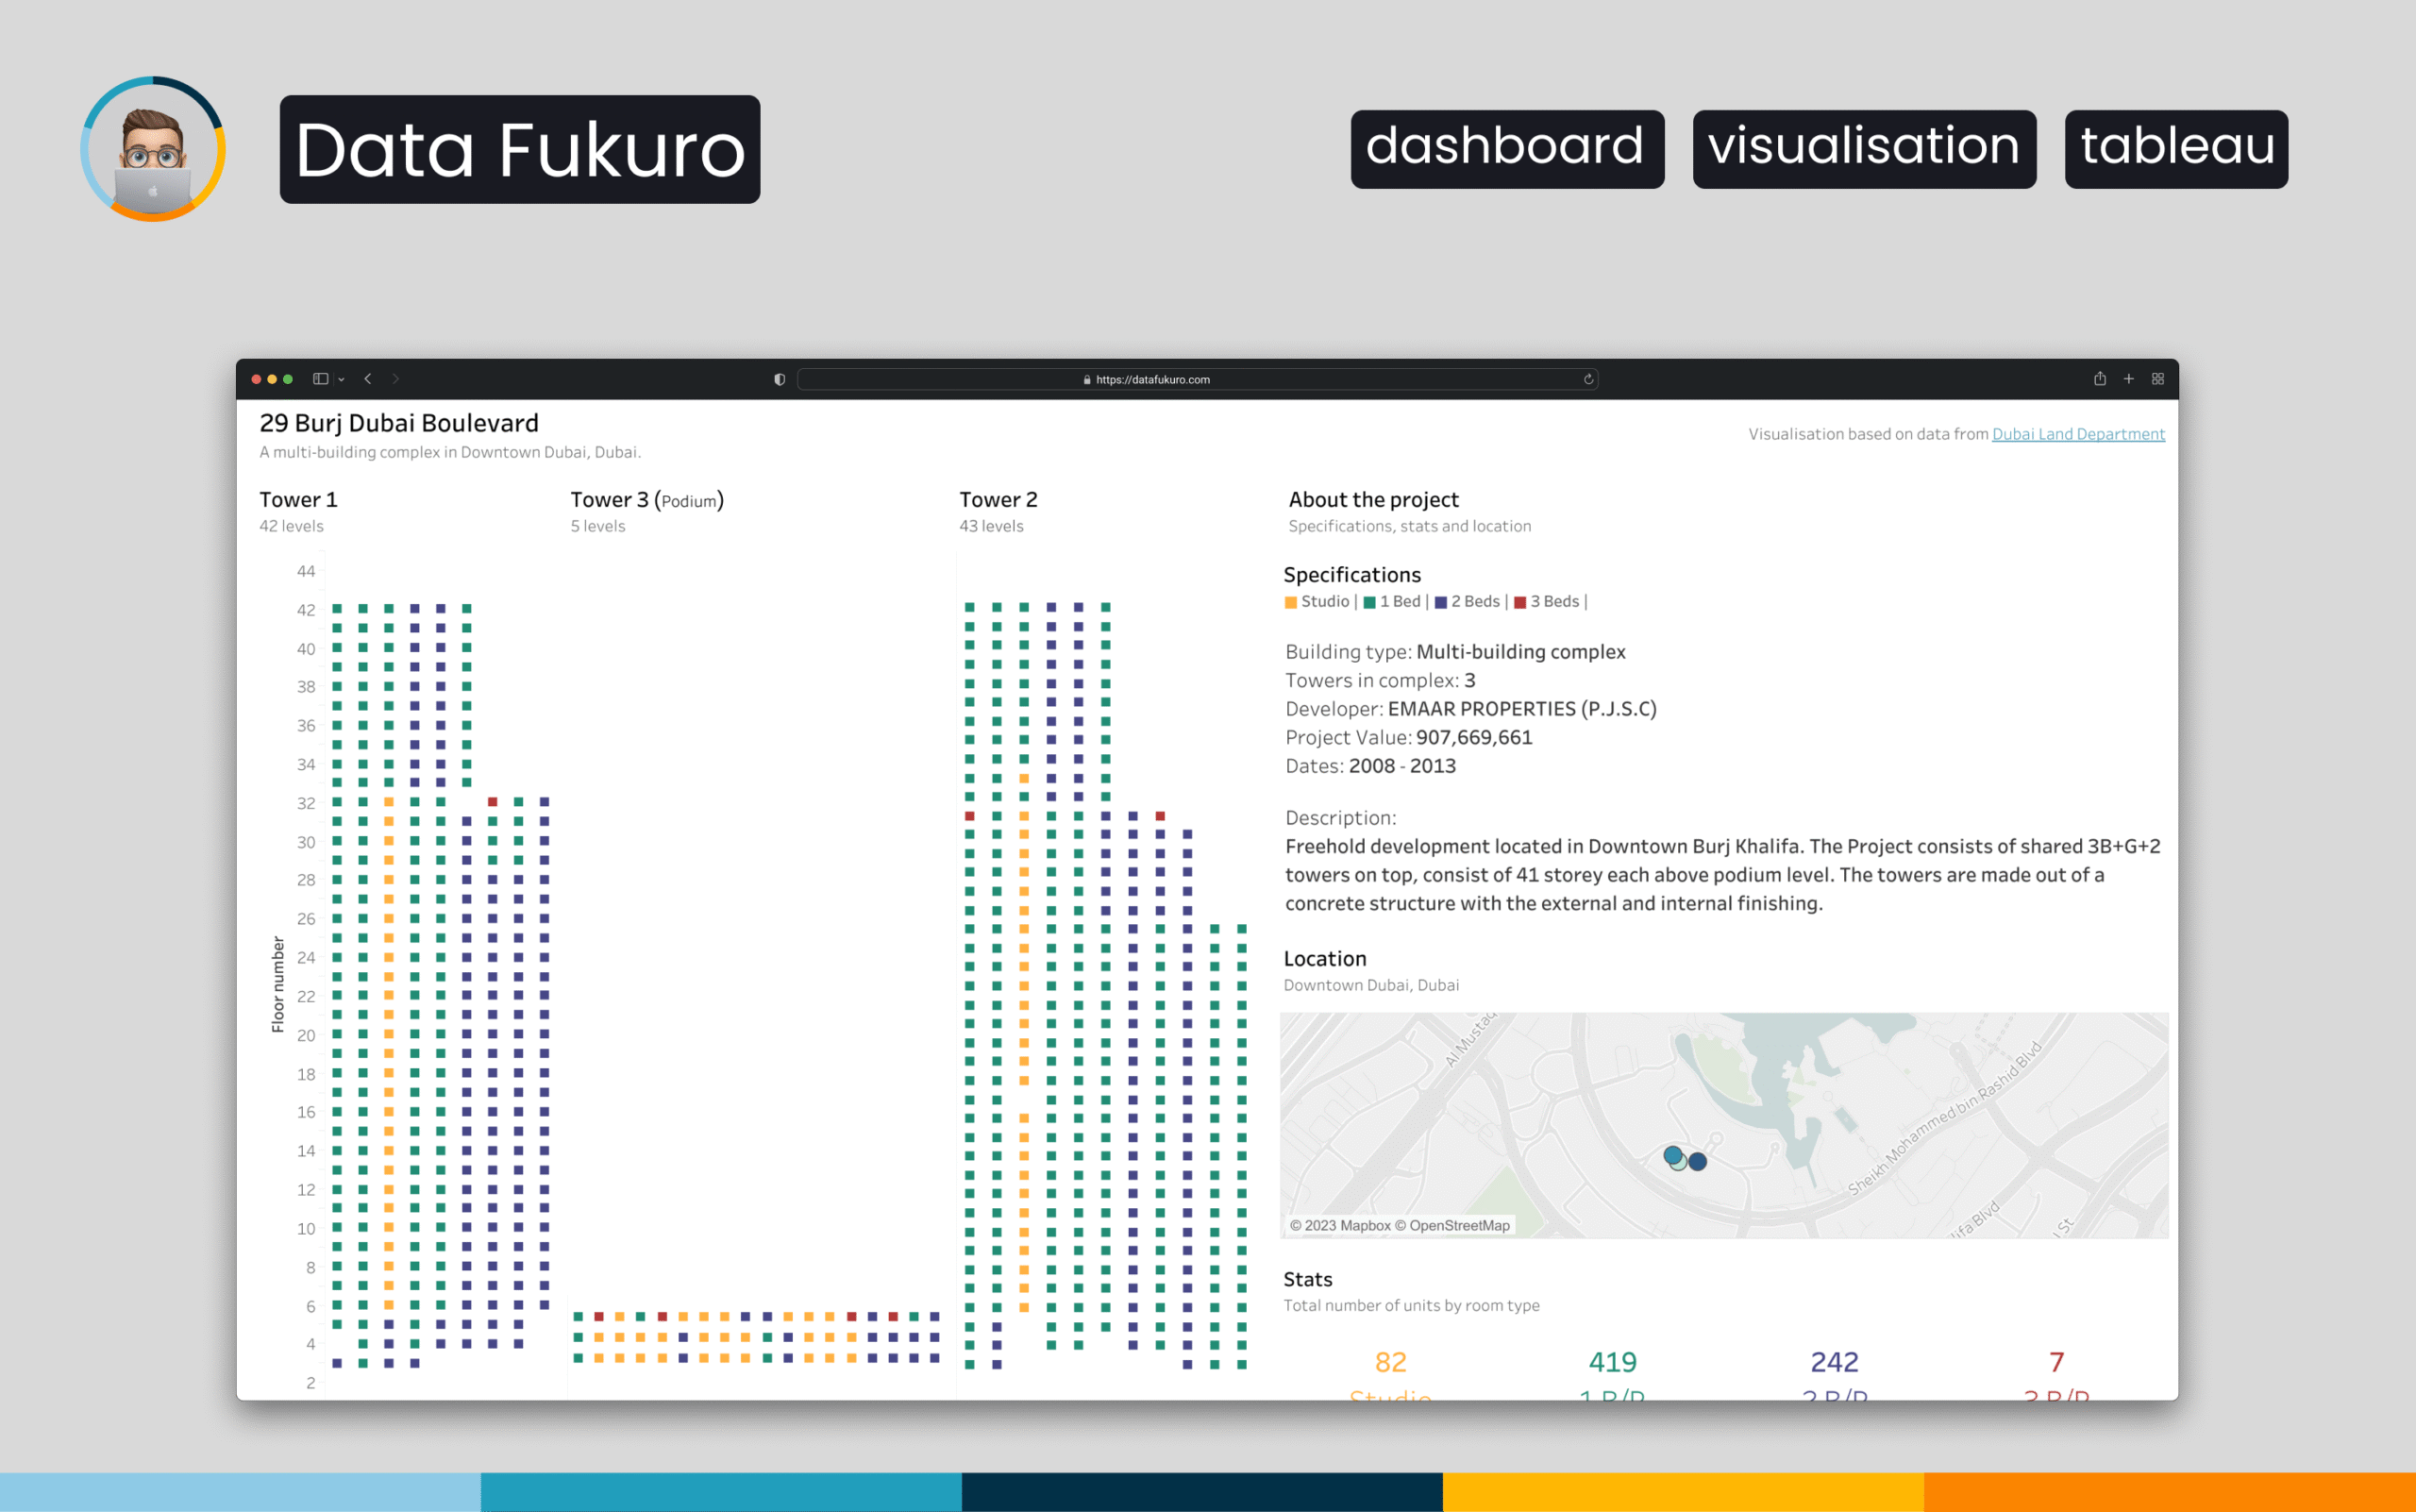
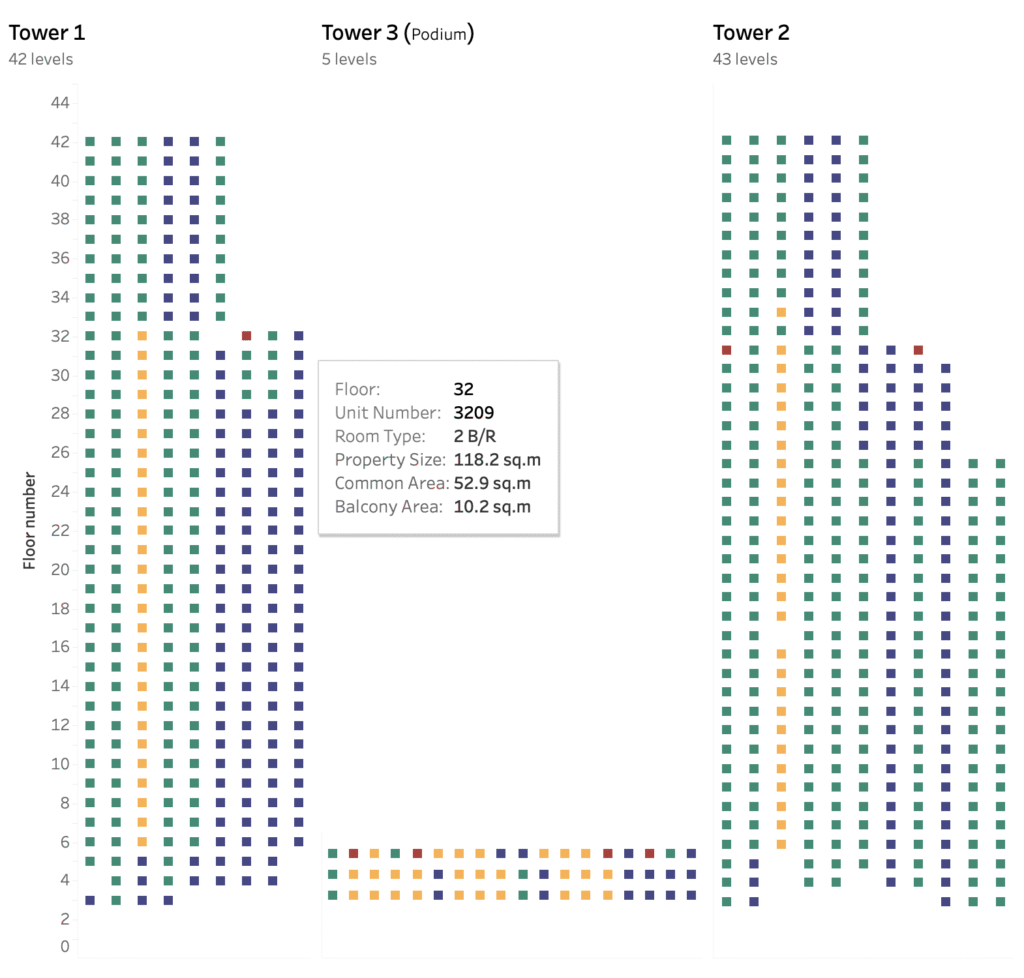
This Tableau dashboard visualizes the 29 BLVD residential complex in Downtown Dubai using a floor-by-floor building layout. Each unit is represented as a coloured square mapped to its exact position within the towers. Users can explore apartment types, specifications and project details interactively, along with a geospatial view of the building’s location.
Description
Business Context & Problem
Large residential complexes often publish unit information in static tables or PDFs, which can make it hard to understand the physical structure of a building. For renters, buyers or analysts, a visual layout is far more intuitive. This project transforms open data from the Dubai Land Department into an interactive dashboard that displays how units are distributed across the towers of 29 Burj Dubai Boulevard (29 BLVD).
Data & Analytical Approach
The dataset includes unit details such as floor number, layout type, size and room configuration. After structuring the data for Tableau, units were assigned coordinates that match the real layout of each tower. Colour-coding was used to distinguish unit types (studio, 1-bed, 2-bed, etc.), creating a clear visual grouping across all floors.
The dashboard was split into two parts:
- a towers view, showing the building’s shape and the exact position of each apartment
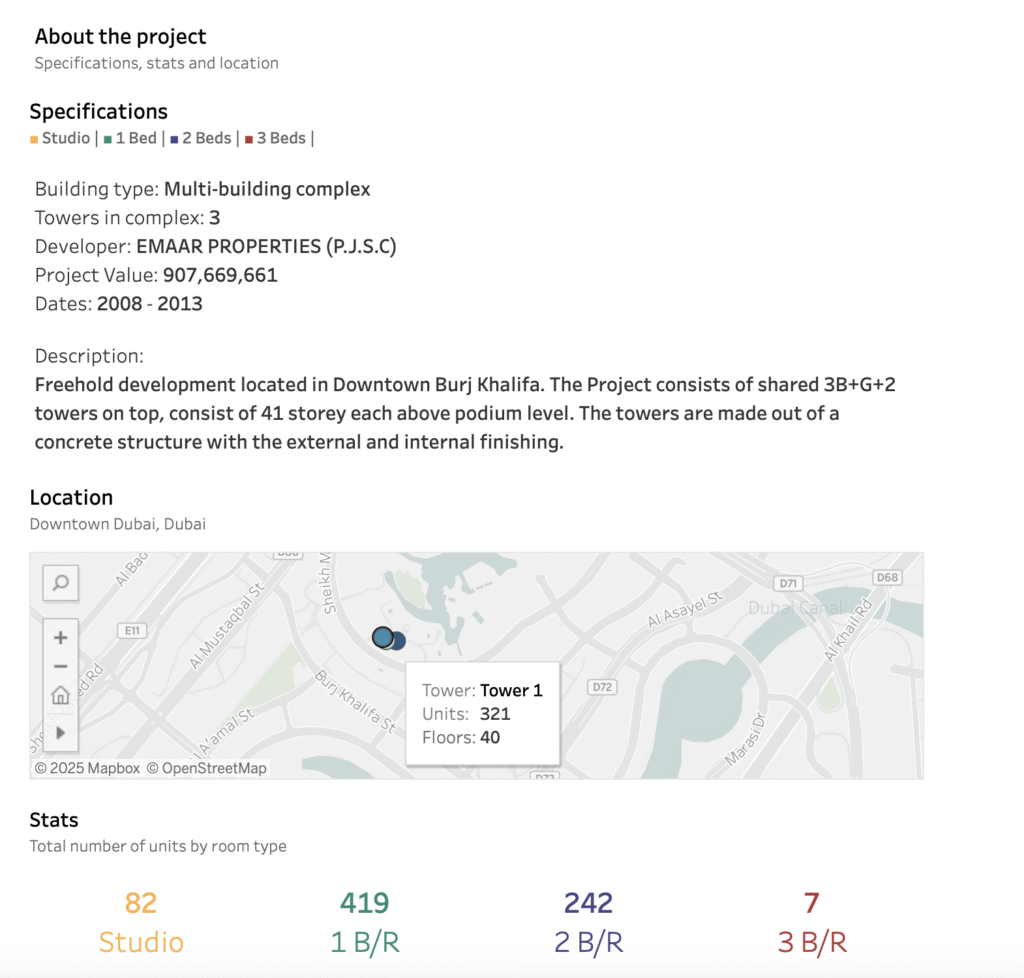
- a project description view, presenting specifications, developer information, dates and a map of the complex
Visualization & Interaction Design
This dashboard is unique because it recreates the building’s silhouette using data alone:
- Each row represents a floor, moving from podium to the top of the tower.
- Each square represents a single apartment, placed according to its real position in the building footprint.
- Colours indicate the unit type, making it easy to spot patterns (e.g., which floors have mostly studios, where larger units are located, etc.).
Hover actions reveal unit-level details such as area, room type and common-area size.
A separate panel summarizes the project’s specifications and includes an interactive map for geographic context.
Key Insights & Final Recommendations
The layout reveals clear segmentation between apartment types across the towers — studios concentrated on certain floors, one-bedroom and two-bedroom units distributed in predictable vertical patterns.
For anyone studying the Dubai rental market, this dashboard offers a fast way to understand building composition without scanning long lists or floor plans.
Overall, the project provides a clean, intuitive visual tool for exploring one of Downtown Dubai’s well-known residential complexes, blending spatial design with real-estate analytics.