Project details:
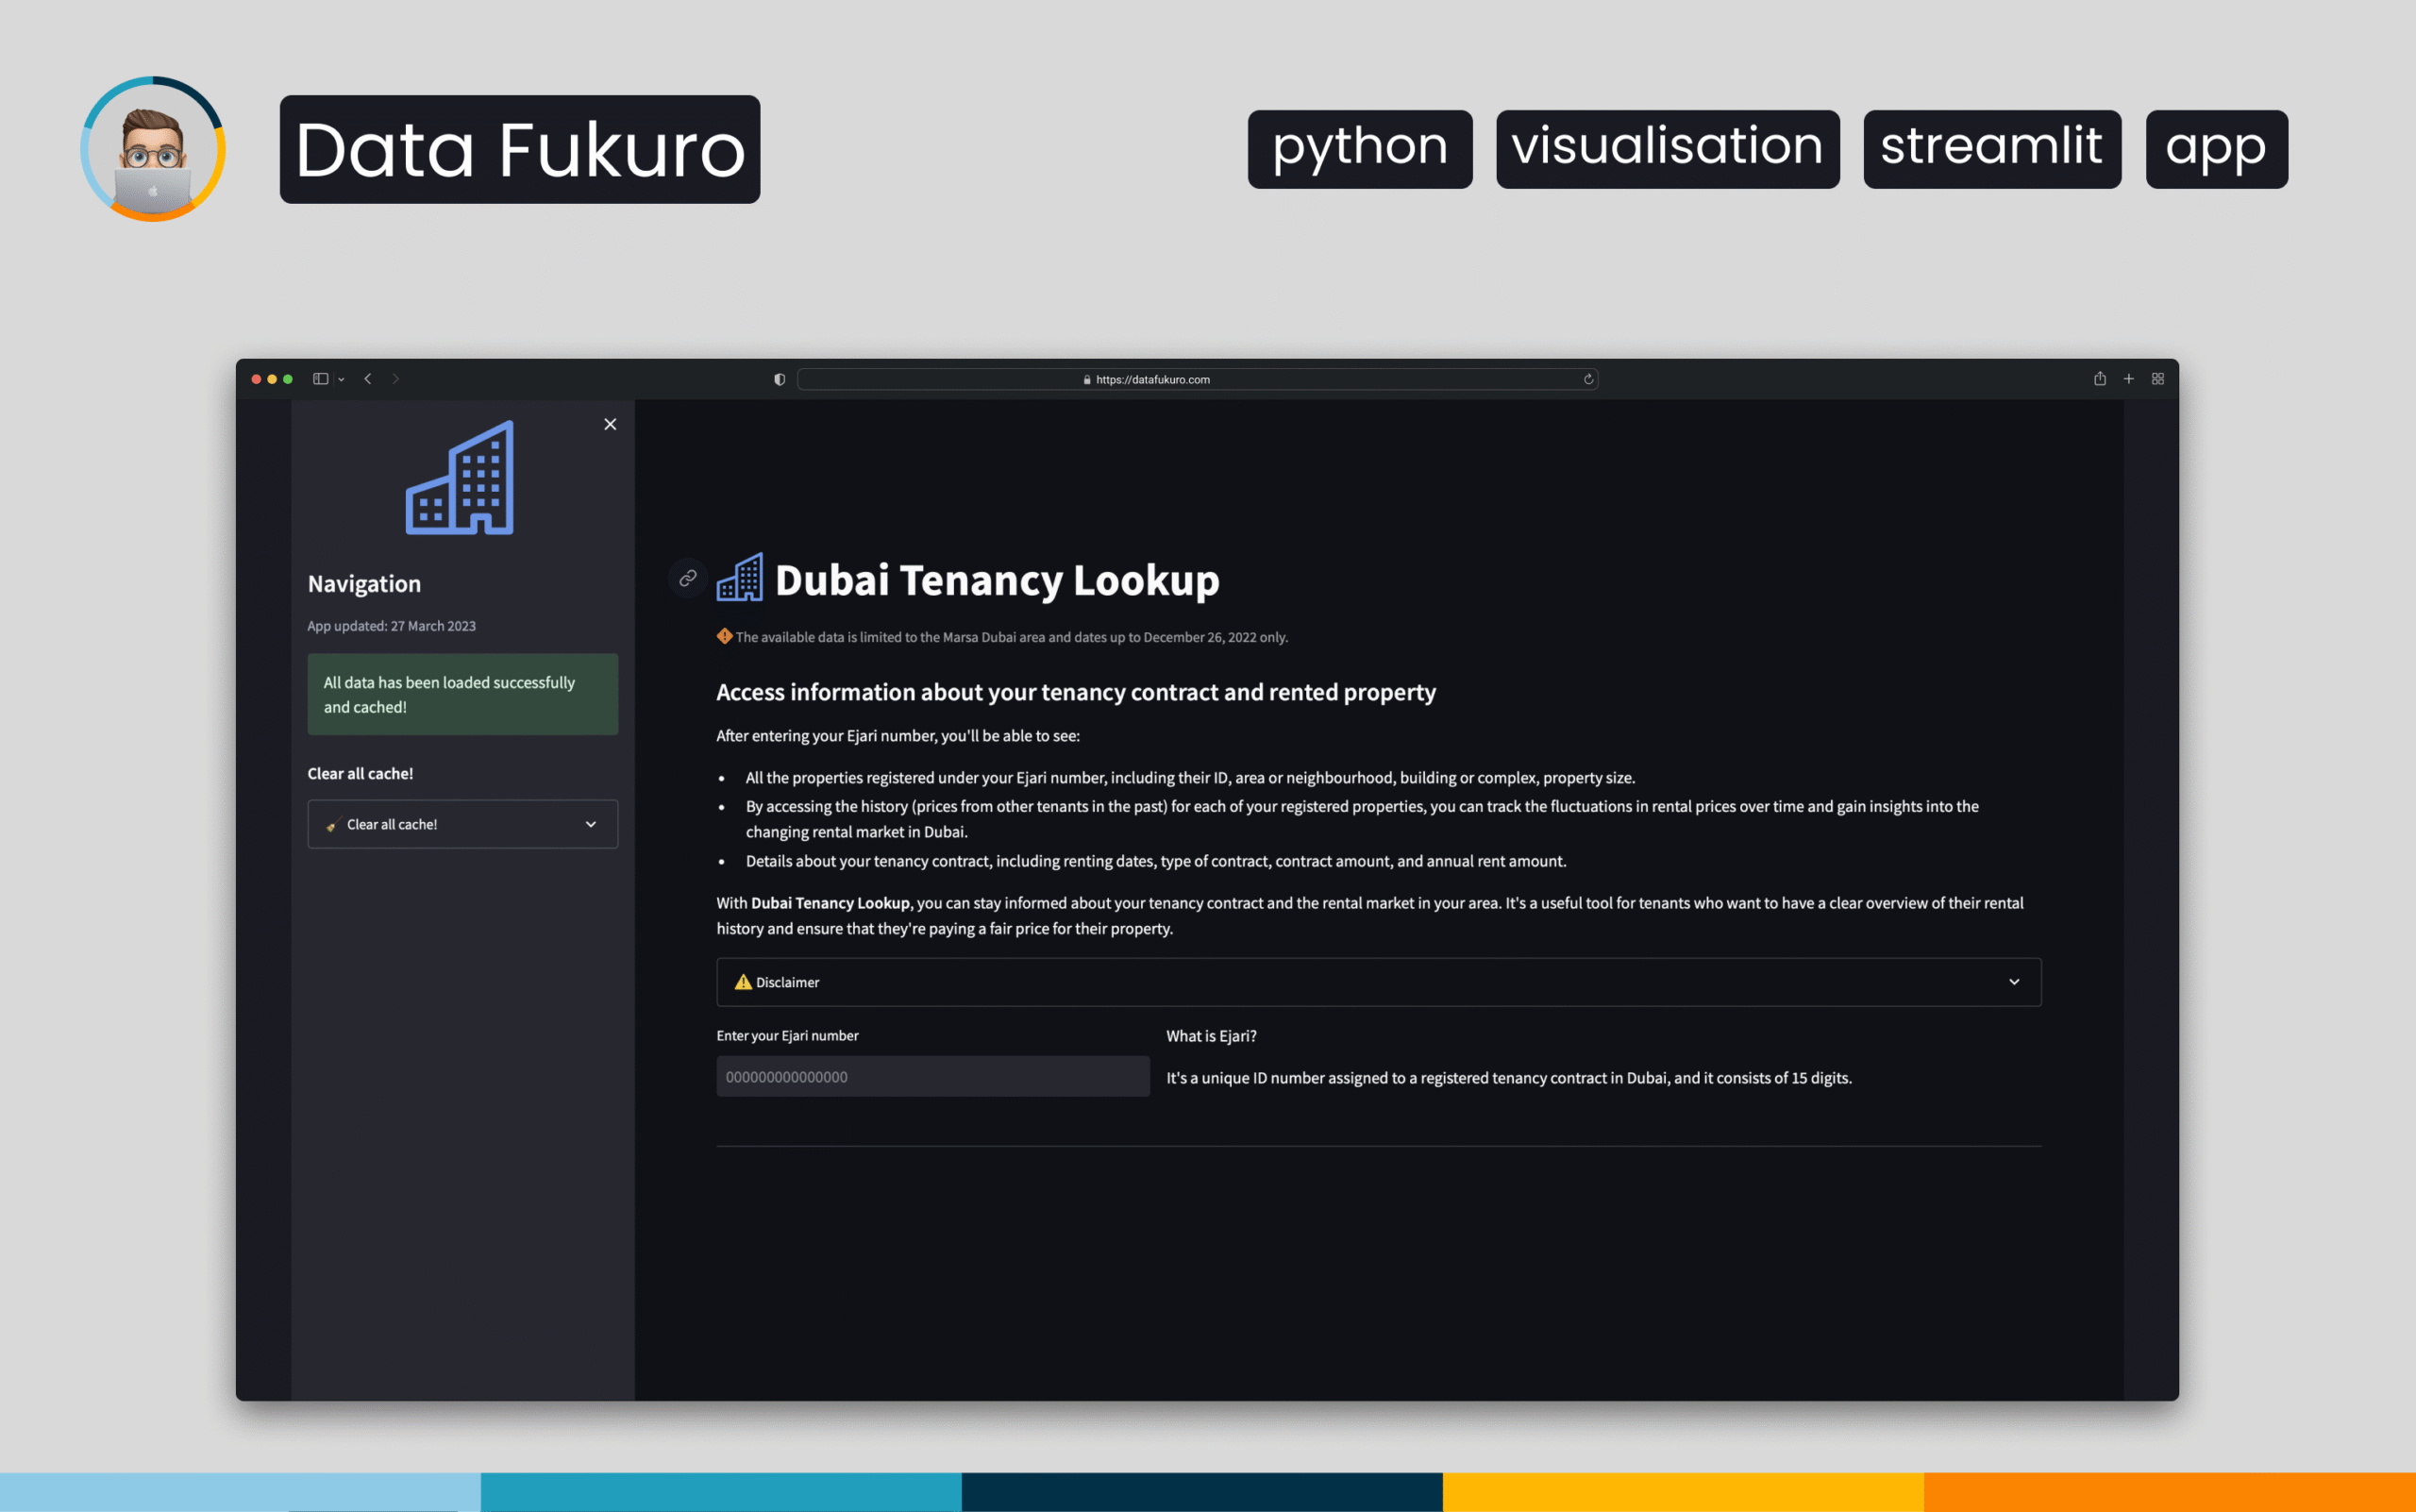
Dubai Tenancy Lookup is a Streamlit web app that lets users explore rental history and building details using their Ejari number. The tool aggregates open data from the Dubai Land Department, showing property information, past rental prices, building characteristics and location maps. It provides a clear overview of a unit’s rental trends and market context.
Description
Business Context & Problem
Dubai’s rental market can be difficult to navigate, especially for tenants who want to understand whether their contract is fairly priced or how a unit compares to similar properties. Official data is available, but not easily accessible or user-friendly.
This project creates a simple, interactive web application that helps tenants look up their registered properties, view historical rental prices and explore building information in one place.
Data & Analytical Approach
The app uses data from the Dubai Land Department, including property specifications, building attributes and rental contract history. The data was cleaned, structured and cached for fast interaction.
Each Ejari number retrieves the units associated with it, along with rental amounts, contract dates, property size and other features. For buildings, additional metadata such as number of units, developer, construction dates and nearby landmarks is displayed.
Application Design & Functionality
The Streamlit interface is organized into several clear sections:
- Tenancy Lookup
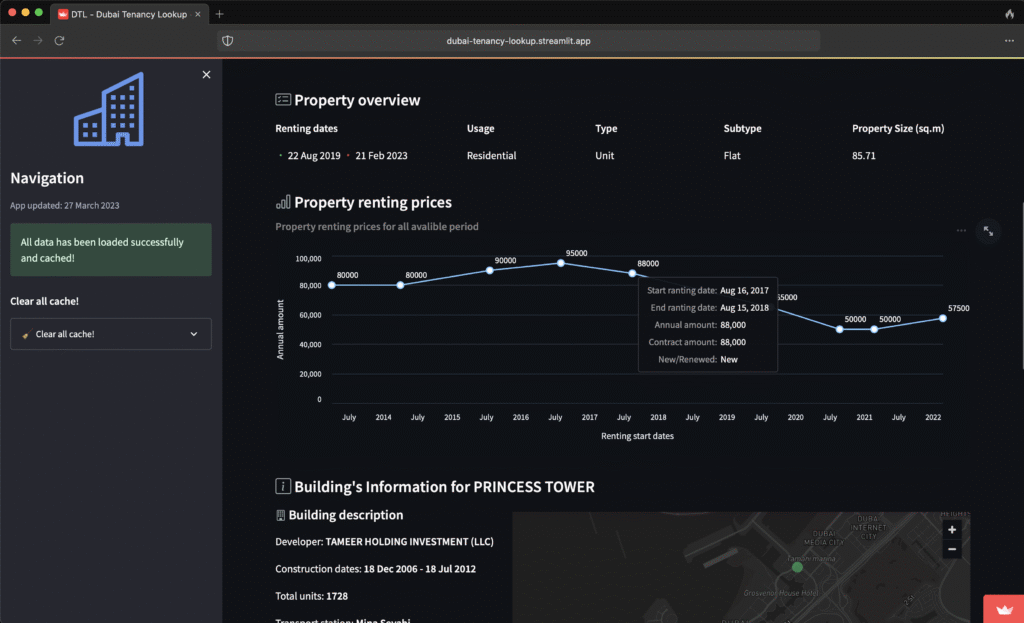
Users enter an Ejari number to access all properties registered under that contract. Each unit displays its full rental history and contract details. - Rental Price Trends
Line charts show how annual rent has changed over time for the selected unit, offering context for negotiations or market comparisons. - Building Details
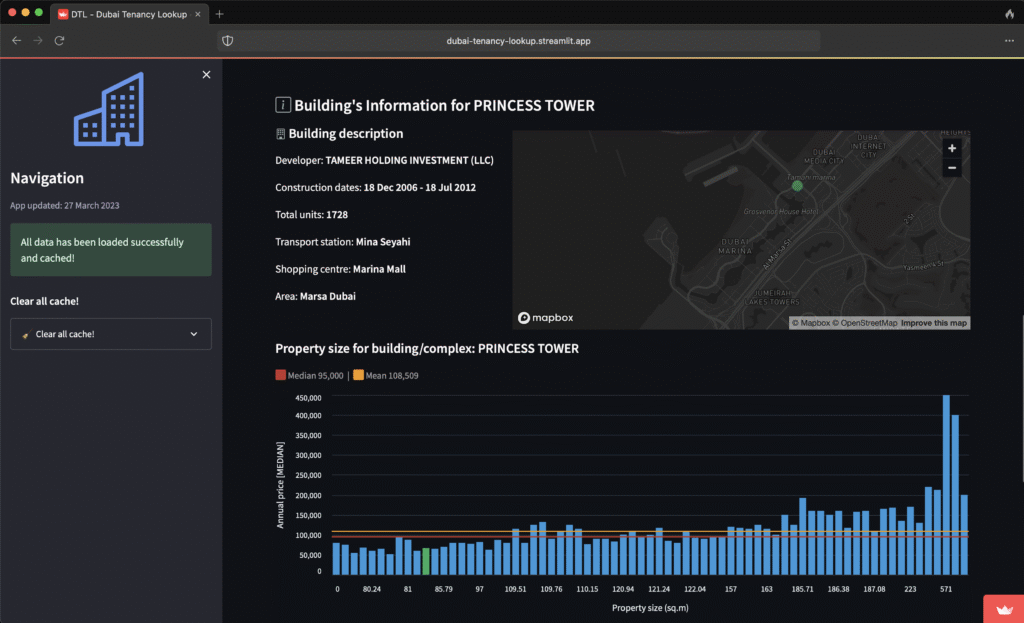
A structured panel presents building information: developer, construction period, unit count and nearby transport or amenities. - Geospatial View
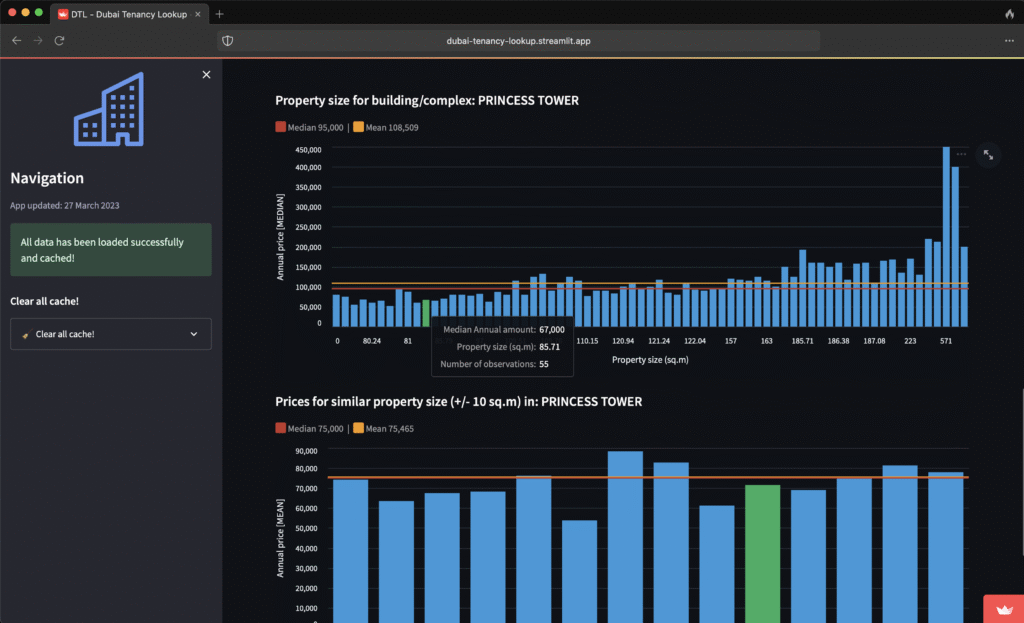
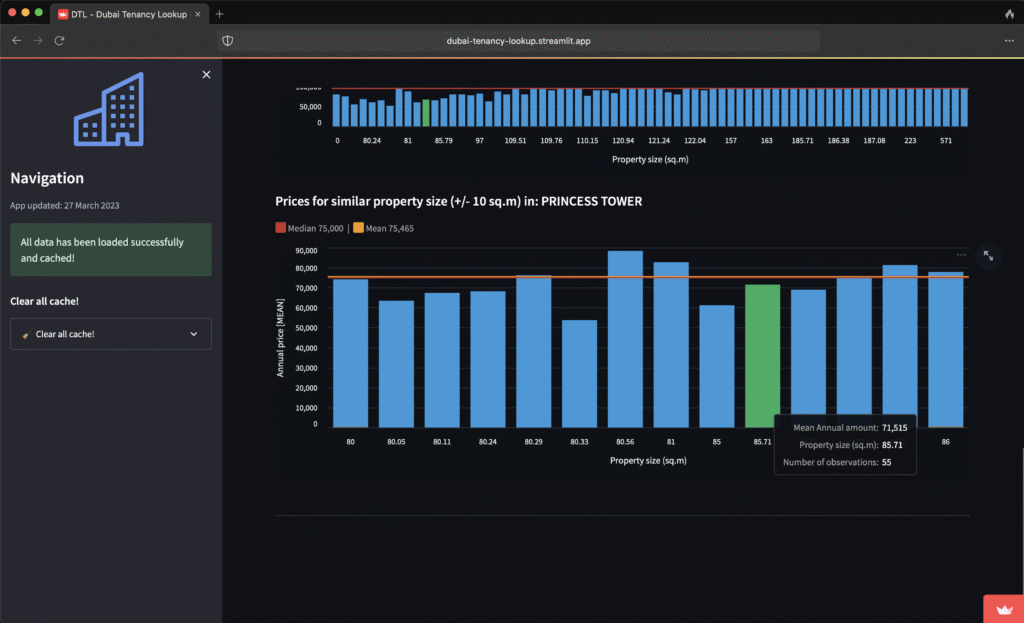
An interactive Mapbox map locates the building and highlights its footprint within the neighbourhood. - Comparative Price Analysis
Bar charts illustrate the distribution of rental prices in the same building, grouped by property size and similar unit categories. This helps users understand whether their rent is aligned with the market.
The app uses caching to load data efficiently, keeping the experience responsive even with large datasets.
Key Insights & Final Recommendations
The tool provides transparency in a market where pricing information can be fragmented. Tenants can quickly understand how their contract compares to others, while property analysts can use the visualizations to observe patterns across different buildings.
Future enhancements could include neighbourhood comparisons, predictive pricing models or integration with additional datasets to expand the scope beyond building-level insights.